2016
Patchett, John; Samsel, Francesca; Tsai, Karen; Gisler, Galen; Rogers, David; Abram, Greg; Turton, Terece
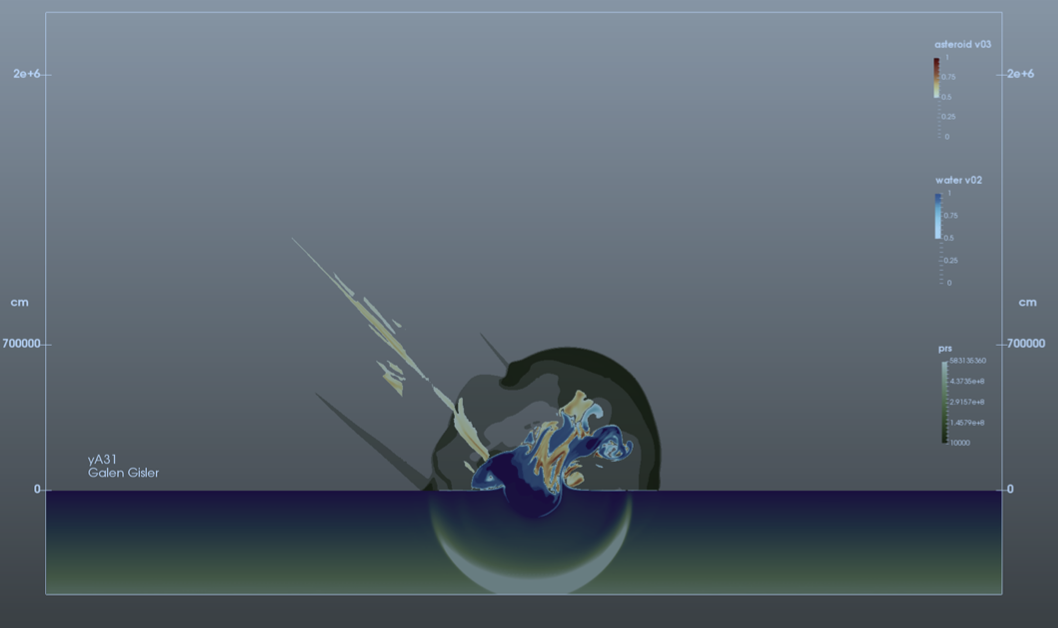
Visualization and Analysis of Threats from Asteroid Ocean Impacts Proceedings Article
In: 2016, (Winner, Best Scientific Visualization & Data Analytics Showcase; LA-UR-16-26258).
Abstract | Links | BibTeX | Tags: asteroid, visualization and data analysis
@inproceedings{Patchett2016asteroidvis,

title = {Visualization and Analysis of Threats from Asteroid Ocean Impacts},

author = {John Patchett and Francesca Samsel and Karen Tsai and Galen Gisler and David Rogers and Greg Abram and Terece Turton},

url = {http://datascience.dsscale.org/wp-content/uploads/2017/08/VisualizationAndAnalysisOfThreatsFromAsteroidOceanImpacts.pdf},

year  = {2016},

date = {2016-01-01},

journal = {2016 ACM/IEEE International Conference for High Performance Computing, Networking, Storage, and Analysis (SC)},

abstract = {An asteroid colliding with earth can have grave consequences. An impact in the ocean has complex effects as the kinetic energy of the asteroid is transferred to the water, potentially causing a tsunami or other distant effect. Scientists at Los Alamos National Laboratory are using the xRage simulation code on high performance computing (HPC) systems to understand the range of possible behaviors of an asteroid impacting the ocean. By running ensembles of large scale 3D simulations, scientists can study a set of potential factors for asteroid-generated tsunamis (AGTs) such as angle of impact, asteroid mass and air burst elevation. These studies help scientists understand the consequences of asteroid impacts such as water dispersement into the atmosphere, which can impact the global climate, or tsunami creation, which can place population centers at risk. The results of these simulations will support NASA’s Office of Planetary Defense in deciding how to best track near-Earth objects (NEOs).},

note = {Winner, Best Scientific Visualization & Data Analytics Showcase; LA-UR-16-26258},

keywords = {asteroid, visualization and data analysis},

pubstate = {published},

tppubtype = {inproceedings}

}
2011
Ahrens, James; Rogers, David; Springmeyer, Becky; Brugger, Eric; Crossno, Patricia; Jiang, Ming; Harrison, Cyrus; Monroe, Laura; Tomlinson, Bob; Pavlakos, Dino; Childs, Hank; Klasky, Scott; Ma, Kwan-Liu
Visualization and data analysis at the exascale Technical Report
Los Alamos National Laboratory (LANL) 2011, (LLNL-TR-474731).
Abstract | Links | BibTeX | Tags: exascale, visualization and data analysis
@techreport{ahrens2011visualization,

title = {Visualization and data analysis at the exascale},

author = {James Ahrens and David Rogers and Becky Springmeyer and Eric Brugger and Patricia Crossno and Ming Jiang and Cyrus Harrison and Laura Monroe and Bob Tomlinson and Dino Pavlakos and Hank Childs and Scott Klasky and Kwan-Liu Ma},

url = {http://datascience.dsscale.org/wp-content/uploads/2016/06/VisualizationAndDataAnalysisAtTheExascale.pdf},

year  = {2011},

date = {2011-01-01},

institution = {Los Alamos National Laboratory (LANL)},

abstract = {The scope of our working group is scientific visualization and data analysis. Scientific visualization refers to the process of transforming scientific simulation and experimental data into images to facilitate visual understanding. Data analys is refers to the process of transforming data into an information-rich form via mathematical or computational algorithms to promote better understanding. We share scope on data management with the Storage group. Data management refers to the process of tracking, organizing and enhancing the use of scientific data. The purpose of our work is to enable scientific discovery and understanding. Visualization and data analysis has a broad scope as an integral part of scientific simulations and experiments; it is also a distinct separate service for scientific discovery, presen tation and documentation purposes. Our scope includes an exascale software and hardware infrastru cture that effectively supports visualization and data analysis.},

note = {LLNL-TR-474731},

keywords = {exascale, visualization and data analysis},

pubstate = {published},

tppubtype = {techreport}

}
Patchett, John; Samsel, Francesca; Tsai, Karen; Gisler, Galen; Rogers, David; Abram, Greg; Turton, Terece
Visualization and Analysis of Threats from Asteroid Ocean Impacts Proceedings Article
In: 2016, (Winner, Best Scientific Visualization & Data Analytics Showcase; LA-UR-16-26258).
@inproceedings{Patchett2016asteroidvis,

title = {Visualization and Analysis of Threats from Asteroid Ocean Impacts},

author = {John Patchett and Francesca Samsel and Karen Tsai and Galen Gisler and David Rogers and Greg Abram and Terece Turton},

url = {http://datascience.dsscale.org/wp-content/uploads/2017/08/VisualizationAndAnalysisOfThreatsFromAsteroidOceanImpacts.pdf},

year  = {2016},

date = {2016-01-01},

journal = {2016 ACM/IEEE International Conference for High Performance Computing, Networking, Storage, and Analysis (SC)},

abstract = {An asteroid colliding with earth can have grave consequences. An impact in the ocean has complex effects as the kinetic energy of the asteroid is transferred to the water, potentially causing a tsunami or other distant effect. Scientists at Los Alamos National Laboratory are using the xRage simulation code on high performance computing (HPC) systems to understand the range of possible behaviors of an asteroid impacting the ocean. By running ensembles of large scale 3D simulations, scientists can study a set of potential factors for asteroid-generated tsunamis (AGTs) such as angle of impact, asteroid mass and air burst elevation. These studies help scientists understand the consequences of asteroid impacts such as water dispersement into the atmosphere, which can impact the global climate, or tsunami creation, which can place population centers at risk. The results of these simulations will support NASA’s Office of Planetary Defense in deciding how to best track near-Earth objects (NEOs).},

note = {Winner, Best Scientific Visualization & Data Analytics Showcase; LA-UR-16-26258},

keywords = {},

pubstate = {published},

tppubtype = {inproceedings}

}
Ahrens, James; Rogers, David; Springmeyer, Becky; Brugger, Eric; Crossno, Patricia; Jiang, Ming; Harrison, Cyrus; Monroe, Laura; Tomlinson, Bob; Pavlakos, Dino; Childs, Hank; Klasky, Scott; Ma, Kwan-Liu
Visualization and data analysis at the exascale Technical Report
Los Alamos National Laboratory (LANL) 2011, (LLNL-TR-474731).
@techreport{ahrens2011visualization,

title = {Visualization and data analysis at the exascale},

author = {James Ahrens and David Rogers and Becky Springmeyer and Eric Brugger and Patricia Crossno and Ming Jiang and Cyrus Harrison and Laura Monroe and Bob Tomlinson and Dino Pavlakos and Hank Childs and Scott Klasky and Kwan-Liu Ma},

url = {http://datascience.dsscale.org/wp-content/uploads/2016/06/VisualizationAndDataAnalysisAtTheExascale.pdf},

year  = {2011},

date = {2011-01-01},

institution = {Los Alamos National Laboratory (LANL)},

abstract = {The scope of our working group is scientific visualization and data analysis. Scientific visualization refers to the process of transforming scientific simulation and experimental data into images to facilitate visual understanding. Data analys is refers to the process of transforming data into an information-rich form via mathematical or computational algorithms to promote better understanding. We share scope on data management with the Storage group. Data management refers to the process of tracking, organizing and enhancing the use of scientific data. The purpose of our work is to enable scientific discovery and understanding. Visualization and data analysis has a broad scope as an integral part of scientific simulations and experiments; it is also a distinct separate service for scientific discovery, presen tation and documentation purposes. Our scope includes an exascale software and hardware infrastru cture that effectively supports visualization and data analysis.},

note = {LLNL-TR-474731},

keywords = {},

pubstate = {published},

tppubtype = {techreport}

}