2009
Woodring, Jonathan; Shen, Han-Wei
Multiscale time activity data exploration via temporal clustering visualization spreadsheet Journal Article
In: Visualization and Computer Graphics, IEEE Transactions on, vol. 15, no. 1, pp. 123–137, 2009.
Abstract | Links | BibTeX | Tags: animation, clustering, filter banks, K-means, time histogram, time-varying, transfer function, visualization spreadsheet, Wavelet
@article{woodring2009multiscale,

title = {Multiscale time activity data exploration via temporal clustering visualization spreadsheet},

author = {Jonathan Woodring and Han-Wei Shen},

url = {http://datascience.dsscale.org/wp-content/uploads/2016/06/MultiscaleTimeActivityDataExplorationViaTemporalClusteringVisualizationSpreadsheet.pdf},

year  = {2009},

date = {2009-01-01},

journal = {Visualization and Computer Graphics, IEEE Transactions on},

volume = {15},

number = {1},

pages = {123--137},

publisher = {IEEE},

abstract = {Time-varying data is usually explored by animation or arrays of static images. Neither is particularly effective for classifying data by different temporal activities. Important temporal trends can be missed due to the lack of ability to find them with current visualization methods. In this paper, we propose a method to explore data at different temporal resolutions to discover and highlight data based upon time-varying trends. Using the wavelet transform along the time axis, we transform data points into multiscale time series curve sets. The time curves are clustered so that data of similar activity are grouped together at different temporal resolutions. The data are displayed to the user in a global time view spreadsheet, where she is able to select temporal clusters of data points and filter and brush data across temporal scales. With our method, a user can interact with data based on time activities and create expressive visualizations.},

keywords = {animation, clustering, filter banks, K-means, time histogram, time-varying, transfer function, visualization spreadsheet, Wavelet},

pubstate = {published},

tppubtype = {article}

}
2003
Woodring, Jonathan; Wang, Chaoli; Shen, Han-Wei
High dimensional direct rendering of time-varying volumetric data Proceedings Article
In: IEEE, 2003.
Abstract | Links | BibTeX | Tags: hyperprojection, hyperslice, inte- gration operator, raycasting, time-varying data, transfer function, volume rendering
@inproceedings{Woodring2003,
title = {High dimensional direct rendering of time-varying volumetric data},
author = {Jonathan Woodring and Chaoli Wang and Han-Wei Shen},
url = {http://datascience.dsscale.org/wp-content/uploads/2016/06/HighDimensionalDirectRenderingOfTime-VaryingVolumetricData.pdf},
year = {2003},
date = {2003-01-01},
publisher = {IEEE},
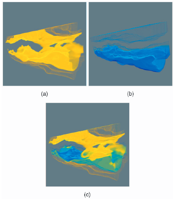
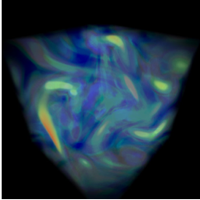
abstract = {We present an alternative method for viewing time-varying volu- metric data. We consider such data as a four-dimensional data field, rather than considering space and time as separate entities. If we treat the data in this manner, we can apply high dimensional slicing and projection techniques to generate an image hyperplane. The user is provided with an intuitive user interface to specify arbitrary hyperplanes in 4D, which can be displayed with standard volume rendering techniques. From the volume specification, we are able to extract arbitrary hyperslices, combine slices together into a hy- perprojection volume, or apply a 4D raycasting method to generate the same results. In combination with appropriate integration op- erators and transfer functions, we are able to extract and present different space-time features to the user.},
keywords = {hyperprojection, hyperslice, inte- gration operator, raycasting, time-varying data, transfer function, volume rendering},
pubstate = {published},
tppubtype = {inproceedings}
}
Woodring, Jonathan; Shen, Han-Wei
Multiscale time activity data exploration via temporal clustering visualization spreadsheet Journal Article
In: Visualization and Computer Graphics, IEEE Transactions on, vol. 15, no. 1, pp. 123–137, 2009.
@article{woodring2009multiscale,

title = {Multiscale time activity data exploration via temporal clustering visualization spreadsheet},

author = {Jonathan Woodring and Han-Wei Shen},

url = {http://datascience.dsscale.org/wp-content/uploads/2016/06/MultiscaleTimeActivityDataExplorationViaTemporalClusteringVisualizationSpreadsheet.pdf},

year  = {2009},

date = {2009-01-01},

journal = {Visualization and Computer Graphics, IEEE Transactions on},

volume = {15},

number = {1},

pages = {123--137},

publisher = {IEEE},

abstract = {Time-varying data is usually explored by animation or arrays of static images. Neither is particularly effective for classifying data by different temporal activities. Important temporal trends can be missed due to the lack of ability to find them with current visualization methods. In this paper, we propose a method to explore data at different temporal resolutions to discover and highlight data based upon time-varying trends. Using the wavelet transform along the time axis, we transform data points into multiscale time series curve sets. The time curves are clustered so that data of similar activity are grouped together at different temporal resolutions. The data are displayed to the user in a global time view spreadsheet, where she is able to select temporal clusters of data points and filter and brush data across temporal scales. With our method, a user can interact with data based on time activities and create expressive visualizations.},

keywords = {},

pubstate = {published},

tppubtype = {article}

}
Woodring, Jonathan; Wang, Chaoli; Shen, Han-Wei
High dimensional direct rendering of time-varying volumetric data Proceedings Article
In: IEEE, 2003.
@inproceedings{Woodring2003,

title = {High dimensional direct rendering of time-varying volumetric data},

author = {Jonathan Woodring and Chaoli Wang and Han-Wei Shen},

url = {http://datascience.dsscale.org/wp-content/uploads/2016/06/HighDimensionalDirectRenderingOfTime-VaryingVolumetricData.pdf},

year  = {2003},

date = {2003-01-01},

publisher = {IEEE},

abstract = {We present an alternative method for viewing time-varying volu- metric data. We consider such data as a four-dimensional data field, rather than considering space and time as separate entities. If we treat the data in this manner, we can apply high dimensional slicing and projection techniques to generate an image hyperplane. The user is provided with an intuitive user interface to specify arbitrary hyperplanes in 4D, which can be displayed with standard volume rendering techniques. From the volume specification, we are able to extract arbitrary hyperslices, combine slices together into a hy- perprojection volume, or apply a 4D raycasting method to generate the same results. In combination with appropriate integration op- erators and transfer functions, we are able to extract and present different space-time features to the user.},

keywords = {},

pubstate = {published},

tppubtype = {inproceedings}

}