2017
Patchett, John; Gisler, Galen
Deep Water Impact Ensemble Data Set Technical Report
2017, (LA-UR-17-21595).
Abstract | Links | BibTeX | Tags: asteroid, ensemble data set, In situ analysis, ParaView
@techreport{Patchett2017,
title = {Deep Water Impact Ensemble Data Set},
author = {John Patchett and Galen Gisler},
url = {http://datascience.dsscale.org/wp-content/uploads/2017/08/DeepWaterImpactEnsembleDataSet_Revision1.pdf},
year = {2017},
date = {2017-05-02},
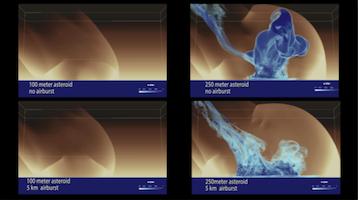
abstract = {This ensemble data set represents the study of asteroid impacts in deep ocean water. NASA’s Planetary Defense Coordination Office [1] is keenly interested to know the lower size limit of dangerous asteroids, so as to focus resources on finding all larger objects that potentially threaten the earth. Since most of the planet’s surface is water, that is where asteroids will most likely impact. This observation has generated a serious debate over the last two decades on just how dangerous impact-induced waves or tsunamis are to populated shorelines.},
note = {LA-UR-17-21595},
keywords = {asteroid, ensemble data set, In situ analysis, ParaView},
pubstate = {published},
tppubtype = {techreport}
}
2016
Ahrens, James Paul
01.11.2016, (Chesapeake Large-Scale Analytics Conference - CLSAC 2016, LA-UR-16-28491).
Abstract | Links | BibTeX | Tags: large-scale data, ParaView, VTK
@misc{Ahrens_2016,
title = {Towards a Scalable, Platform Independent, User-Friendly Analysis Framework for Scientific and Information Oriented Applications},
author = {James Paul Ahrens},
url = {http://datascience.dsscale.org/wp-content/uploads/2017/08/LA-UR-16-28491.pdf},
year = {2016},
date = {2016-11-01},
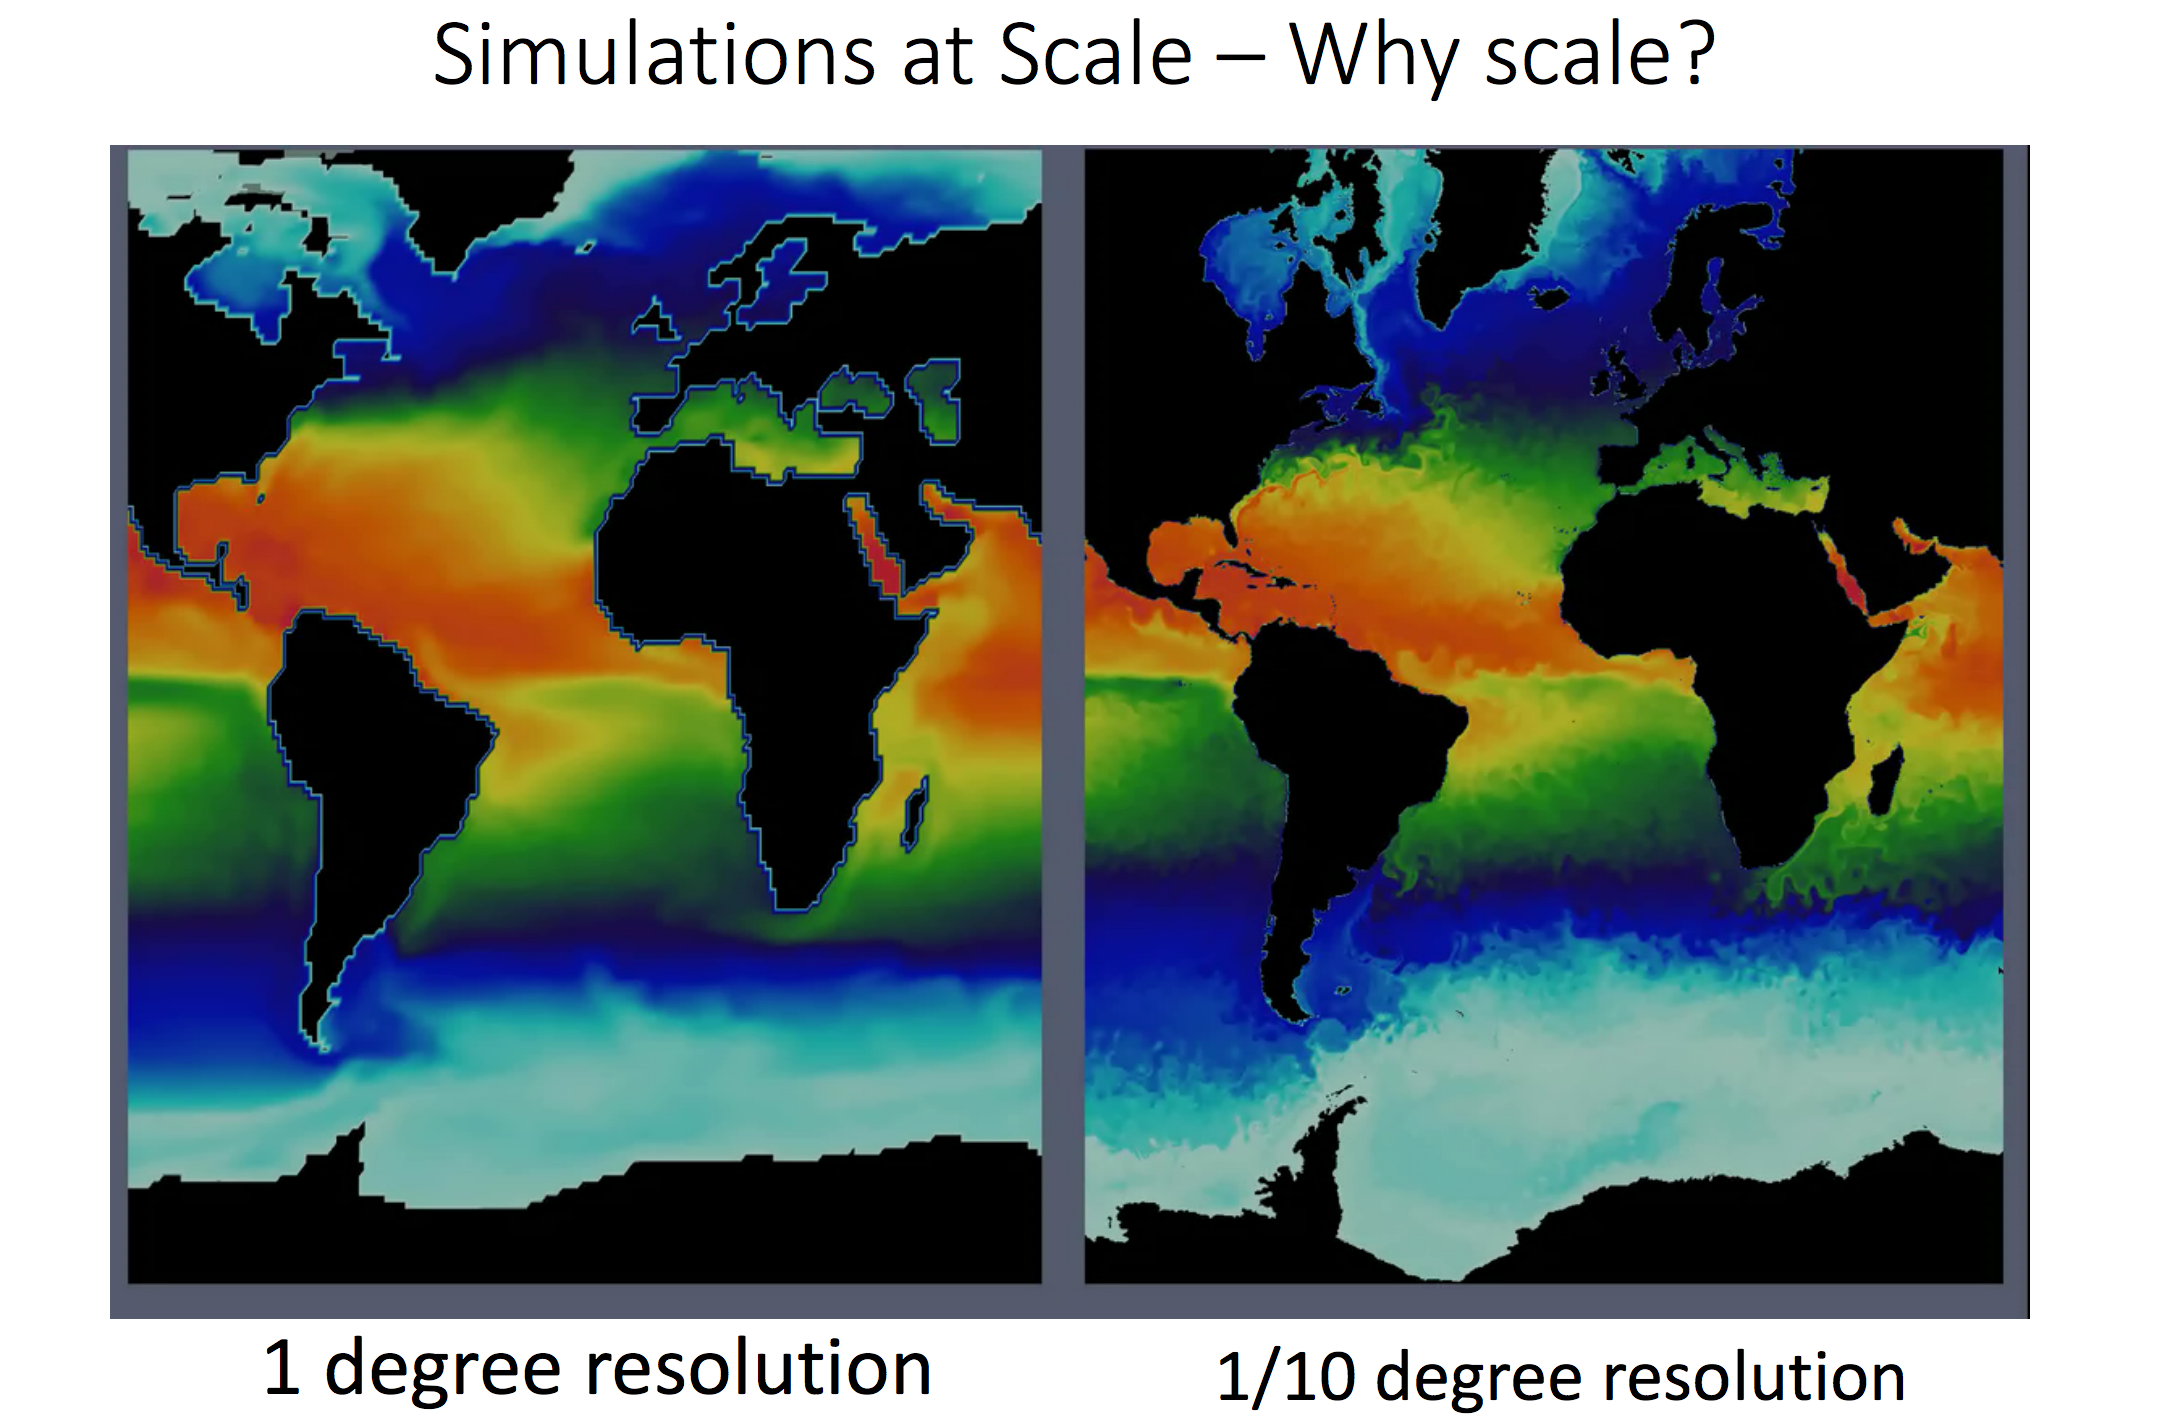
abstract = {Options for extreme scale data analysis are often presented as a stark contrast: write large files to disk for interactive exploratory analysis, or perform in situ analysis to save detailed data about phenomena that a user knows about in advance. We describe a novel framework that offers a middle ground - a highly interactive approach that promotes exploration of extracts from source data streams that significantly reduces data movement and storage. This framework is built upon a collection of scalable, platform independent, open-source packages (vtk and ParaView) that have been developed of the past two decades. In this talk, I will describe these frameworks, connections to information oriented streaming approaches, and highlight applications to real-world analysis challenges.},
note = {Chesapeake Large-Scale Analytics Conference - CLSAC 2016, LA-UR-16-28491},
keywords = {large-scale data, ParaView, VTK},
pubstate = {published},
tppubtype = {presentation}
}
2015
Kares, Robert J.
In-Situ Visualization Experiments with ParaView Cinema in RAGE Technical Report
2015, (LA-UR-15-28026).
Abstract | Links | BibTeX | Tags: catalyst, cinema, ParaView
@techreport{Kares2015,
title = {In-Situ Visualization Experiments with ParaView Cinema in RAGE},
author = {Robert J. Kares},
url = {http://datascience.dsscale.org/wp-content/uploads/2016/06/In-SituVisualizationExperimentsWithParaViewCinemaInRAGE.pdf},
year = {2015},
date = {2015-10-15},
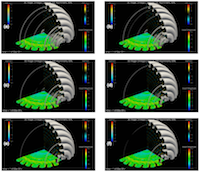
abstract = {In a previous paper Robert Kares described some numerical experiments performed using the ParaView/Catalyst in-situ visualization infrastructure deployed in the Los Alamos RAGE radiation-hydrodynamics code to produce images from a running large scale 3D ICF simulation. One challenge of the in-situ approach apparent in these experiments was the difficulty of choosing parameters likes isosurface values for the visualizations to be produced from the running simulation without the benefit of prior knowledge of the simulation results and the resultant cost of recomputing in-situ generated images when parameters are chosen sub- optimally. A proposed method of addressing this difficulty is to simply render multiple images at runtime with a range of possible parameter values to produce a large database of images and to provide the user with a tool for managing the resulting database of imagery. Recently, ParaView/Catalyst has been extended to include such a capability via the so-called Cinema framework. Here Kares describes some initial experiments with the first delivery of Cinema and make some recommendations for future extensions of Cinema’s capabilities.},
note = {LA-UR-15-28026},
keywords = {catalyst, cinema, ParaView},
pubstate = {published},
tppubtype = {techreport}
}
2014
Kares, Robert J.
Experiments at Scale with In-Situ Visualization Using ParaView/Catalyst in RAGE Technical Report
2014, (LA-UR-14-28528).
Abstract | Links | BibTeX | Tags: catalyst, ParaView
@techreport{Kares2014,
title = {Experiments at Scale with In-Situ Visualization Using ParaView/Catalyst in RAGE},
author = {Robert J. Kares},
url = {http://datascience.dsscale.org/wp-content/uploads/2016/06/ExperimentsAtScaleWithIn-SituVisualizationUsingParaViewCatalystInRAGE.pdf},
year = {2014},
date = {2014-10-14},
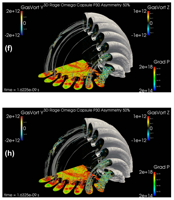
abstract = {In this paper I describe some numerical experiments performed using the ParaView/Catalyst in- situ visualization infrastructure deployed in the Los Alamos RAGE radiation-hydrodynamics code to produce images from a running large scale 3D ICF simulation on the Cielo supercomputer at Los Alamos. The detailed procedures for the creation of the visualizations using ParaView/Catalyst are discussed and several images sequences from the ICF simulation problem produced with the in-situ method are presented. My impressions and conclusions concerning the use of the in-situ visualization method in RAGE are discussed.},
note = {LA-UR-14-28528},
keywords = {catalyst, ParaView},
pubstate = {published},
tppubtype = {techreport}
}
2013
Lo, Li-Ta
Visualizing PSI Simulation with ParaView Presentation
04.10.2013, (LA-UR-13-27631).
Abstract | Links | BibTeX | Tags: ParaView, Plasma Surface Interaction
@misc{Lo2013,
title = {Visualizing PSI Simulation with ParaView},
author = {Li-Ta Lo},
url = {http://datascience.dsscale.org/wp-content/uploads/2016/08/Visualizing_PSI_Simulation_with_ParaView.pdf
http://datascience.dsscale.org/wp-content/uploads/2016/08/freeZ5400all.dump
http://datascience.dsscale.org/wp-content/uploads/2016/08/freeZ5300all.dump},
year = {2013},
date = {2013-10-04},
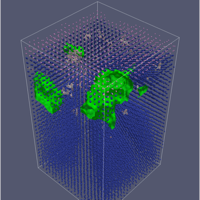
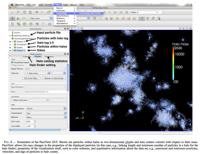
abstract = {This presentation describes the use of ParaView for a Plasma Surface Interaction (PSI) simulation. Two sample datasets from the Large-scale Atomic/Molecular Massively Parallel Simulator (LAMMPS) are included below.},
note = {LA-UR-13-27631},
keywords = {ParaView, Plasma Surface Interaction},
pubstate = {published},
tppubtype = {presentation}
}
2011
Woodring, Jonathan; Heitmann, Katrin; Ahrens, James; Fasel, Patricia; Hsu, Chung-Hsing; Habib, Salman; Pope, Adrian
Analyzing and visualizing cosmological simulations with ParaView Journal Article
In: The Astrophysical Journal Supplement Series, vol. 195, no. 1, pp. 11, 2011, (LA-UR-10-06301).
Abstract | Links | BibTeX | Tags: cosmology, large-scale structure of universe, numerical methods, ParaView
@article{woodring2011analyzing,

title = {Analyzing and visualizing cosmological simulations with ParaView},

author = {Jonathan Woodring and Katrin Heitmann and James Ahrens and Patricia Fasel and Chung-Hsing Hsu and Salman Habib and Adrian Pope},

url = {http://datascience.dsscale.org/wp-content/uploads/2016/06/AnalyzingAndVisualizingCosmologicalSimulationsWithParaView.pdf},

year  = {2011},

date = {2011-01-01},

journal = {The Astrophysical Journal Supplement Series},

volume = {195},

number = {1},

pages = {11},

publisher = {IOP Publishing},

abstract = {The advent of large cosmological sky surveys – ushering in the era of precision cosmology – has been accompanied by ever larger cosmological simulations. The analysis of these simulations, which currently encompass tens of billions of particles and up to trillion particles in the near future, is often as daunting as carrying out the simulations in the first place. Therefore, the development of very efficient analysis tools combining qualitative and quantitative capabilities is a matter of some urgency. In this paper we introduce new analysis features implemented within ParaView, a parallel, open-source visualization toolkit, to analyze large N-body simulations. The new features include particle readers and a very efficient halo finder which identifies friends-of-friends halos and determines common halo properties. In combination with many other functionalities already existing within ParaView, such as histogram routines or interfaces to Python, this enhanced version enables fast, interactive, and convenient analyses of large cosmological simulations. In addition, development paths are available for future extensions.},

note = {LA-UR-10-06301},

keywords = {cosmology, large-scale structure of universe, numerical methods, ParaView},

pubstate = {published},

tppubtype = {article}

}
2009
Patchett, John; Ahrens, James; Ahern, Sean; Pugmire, David
Parallel visualization and analysis with ParaView on a Cray Xt4 Journal Article
In: Cray User Group, 2009, (LA-UR-10-02238).
Abstract | Links | BibTeX | Tags: Parallel Visualization, ParaView
@article{patchett2009parallel,
title = {Parallel visualization and analysis with ParaView on a Cray Xt4},
author = {John Patchett and James Ahrens and Sean Ahern and David Pugmire},
url = {http://datascience.dsscale.org/wp-content/uploads/2016/06/ParallelVisualizationAndAnalysisWithParaViewOnACrayXT4.pdf},
year = {2009},
date = {2009-01-01},
journal = {Cray User Group},
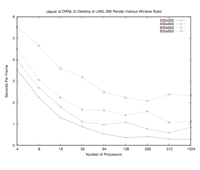
abstract = {Scientific data sets produced by modern supercomputers like ORNL’s Cray XT 4, Jaguar, can be extremely large, making visualization and analysis more difficult as moving large resultant data to dedicated analysis systems can be pro- hibitively expensive. We share our continuing work of integrating a parallel visu- alization system, ParaView, on ORNL’s Jaguar system and our efforts to enable extreme scale interactive data visualization and analysis. We will discuss porting challenges and present performance numbers.},
note = {LA-UR-10-02238},
keywords = {Parallel Visualization, ParaView},
pubstate = {published},
tppubtype = {article}
}
2005
Ahrens, James; Geveci, Berk; Law, Charles
ParaView: An End-User Tool for Large-Data Visualization Journal Article
In: The Visualization Handbook, pp. 717, 2005, (LA-UR-03-1560).
Abstract | Links | BibTeX | Tags: ParaView, visualization
@article{ahrens200536,
title = {ParaView: An End-User Tool for Large-Data Visualization},
author = {James Ahrens and Berk Geveci and Charles Law},
url = {http://datascience.dsscale.org/wp-content/uploads/2016/06/ParaView.pdf},
year = {2005},
date = {2005-01-01},
journal = {The Visualization Handbook},
pages = {717},
publisher = {Citeseer},
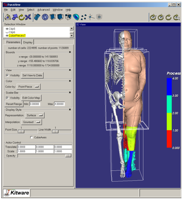
abstract = {This paper describes the design and features of a visualization tool, called ParaViewi, a tool for scientists to visualize and analysis extremely large data sets. The tool provides a graphical user interface for the creation and dynamic execution of visualization tasks. ParaView transparently supports the visualization and rendering of large data sets by executing these programs in parallel on shared or distributed memory machines. ParaView supports hardware-accelerated parallel rendering and achieves interactive rendering performance via level-of-detail techniques. The design balances and integrates a number of diverse requirements including the ability to handle large data, ease of use and extensibility by developers. This paper describes the requirements that guided the design, identifies their importance to scientific users, and discusses key design decision and tradeoffs.},
note = {LA-UR-03-1560},
keywords = {ParaView, visualization},
pubstate = {published},
tppubtype = {article}
}
Patchett, John; Gisler, Galen
Deep Water Impact Ensemble Data Set Technical Report
2017, (LA-UR-17-21595).
@techreport{Patchett2017,

title = {Deep Water Impact Ensemble Data Set},

author = {John Patchett and Galen Gisler},

url = {http://datascience.dsscale.org/wp-content/uploads/2017/08/DeepWaterImpactEnsembleDataSet_Revision1.pdf},

year  = {2017},

date = {2017-05-02},

abstract = {This ensemble data set represents the study of asteroid impacts in deep ocean water. NASA’s Planetary Defense Coordination Office [1] is keenly interested to know the lower size limit of dangerous asteroids, so as to focus resources on finding all larger objects that potentially threaten the earth. Since most of the planet’s surface is water, that is where asteroids will most likely impact. This observation has generated a serious debate over the last two decades on just how dangerous impact-induced waves or tsunamis are to populated shorelines.},

note = {LA-UR-17-21595},

keywords = {},

pubstate = {published},

tppubtype = {techreport}

}
Ahrens, James Paul
01.11.2016, (Chesapeake Large-Scale Analytics Conference - CLSAC 2016, LA-UR-16-28491).
@misc{Ahrens_2016,

title = {Towards a Scalable, Platform Independent, User-Friendly Analysis Framework for Scientific and Information Oriented Applications},

author = {James Paul Ahrens},

url = {http://datascience.dsscale.org/wp-content/uploads/2017/08/LA-UR-16-28491.pdf},

year  = {2016},

date = {2016-11-01},

abstract = {Options for extreme scale data analysis are often presented as a stark contrast: write large files to disk for interactive exploratory analysis, or perform in situ analysis to save detailed data about phenomena that a user knows about in advance. We describe a novel framework that offers a middle ground - a highly interactive approach that promotes exploration of extracts from source data streams that significantly reduces data movement and storage. This framework is built upon a collection of scalable, platform independent, open-source packages (vtk and ParaView) that have been developed of the past two decades. In this talk, I will describe these frameworks, connections to information oriented streaming approaches, and highlight applications to real-world analysis challenges.},

note = {Chesapeake Large-Scale Analytics Conference - CLSAC 2016, LA-UR-16-28491},

keywords = {},

pubstate = {published},

tppubtype = {presentation}

}
Kares, Robert J.
In-Situ Visualization Experiments with ParaView Cinema in RAGE Technical Report
2015, (LA-UR-15-28026).
@techreport{Kares2015,

title = {In-Situ Visualization Experiments with ParaView Cinema in RAGE},

author = {Robert J. Kares},

url = {http://datascience.dsscale.org/wp-content/uploads/2016/06/In-SituVisualizationExperimentsWithParaViewCinemaInRAGE.pdf},

year  = {2015},

date = {2015-10-15},

abstract = {In a previous paper Robert Kares described some numerical experiments performed using the ParaView/Catalyst in-situ visualization infrastructure deployed in the Los Alamos RAGE radiation-hydrodynamics code to produce images from a running large scale 3D ICF simulation. One challenge of the in-situ approach apparent in these experiments was the difficulty of choosing parameters likes isosurface values for the visualizations to be produced from the running simulation without the benefit of prior knowledge of the simulation results and the resultant cost of recomputing in-situ generated images when parameters are chosen sub- optimally. A proposed method of addressing this difficulty is to simply render multiple images at runtime with a range of possible parameter values to produce a large database of images and to provide the user with a tool for managing the resulting database of imagery. Recently, ParaView/Catalyst has been extended to include such a capability via the so-called Cinema framework. Here Kares describes some initial experiments with the first delivery of Cinema and make some recommendations for future extensions of Cinema’s capabilities.},

note = {LA-UR-15-28026},

keywords = {},

pubstate = {published},

tppubtype = {techreport}

}
Kares, Robert J.
Experiments at Scale with In-Situ Visualization Using ParaView/Catalyst in RAGE Technical Report
2014, (LA-UR-14-28528).
@techreport{Kares2014,

title = {Experiments at Scale with In-Situ Visualization Using ParaView/Catalyst in RAGE},

author = {Robert J. Kares},

url = {http://datascience.dsscale.org/wp-content/uploads/2016/06/ExperimentsAtScaleWithIn-SituVisualizationUsingParaViewCatalystInRAGE.pdf},

year  = {2014},

date = {2014-10-14},

abstract = {In this paper I describe some numerical experiments performed using the ParaView/Catalyst in- situ visualization infrastructure deployed in the Los Alamos RAGE radiation-hydrodynamics code to produce images from a running large scale 3D ICF simulation on the Cielo supercomputer at Los Alamos. The detailed procedures for the creation of the visualizations using ParaView/Catalyst are discussed and several images sequences from the ICF simulation problem produced with the in-situ method are presented. My impressions and conclusions concerning the use of the in-situ visualization method in RAGE are discussed.},

note = {LA-UR-14-28528},

keywords = {},

pubstate = {published},

tppubtype = {techreport}

}
Lo, Li-Ta
Visualizing PSI Simulation with ParaView Presentation
04.10.2013, (LA-UR-13-27631).
@misc{Lo2013,

title = {Visualizing PSI Simulation with ParaView},

author = {Li-Ta Lo},

url = {http://datascience.dsscale.org/wp-content/uploads/2016/08/Visualizing_PSI_Simulation_with_ParaView.pdf

http://datascience.dsscale.org/wp-content/uploads/2016/08/freeZ5400all.dump

http://datascience.dsscale.org/wp-content/uploads/2016/08/freeZ5300all.dump},

year  = {2013},

date = {2013-10-04},

abstract = {This presentation describes the use of ParaView for a Plasma Surface Interaction (PSI) simulation. Two sample datasets from the Large-scale Atomic/Molecular Massively Parallel Simulator (LAMMPS) are included below.},

note = {LA-UR-13-27631},

keywords = {},

pubstate = {published},

tppubtype = {presentation}

}
Woodring, Jonathan; Heitmann, Katrin; Ahrens, James; Fasel, Patricia; Hsu, Chung-Hsing; Habib, Salman; Pope, Adrian
Analyzing and visualizing cosmological simulations with ParaView Journal Article
In: The Astrophysical Journal Supplement Series, vol. 195, no. 1, pp. 11, 2011, (LA-UR-10-06301).
@article{woodring2011analyzing,

title = {Analyzing and visualizing cosmological simulations with ParaView},

author = {Jonathan Woodring and Katrin Heitmann and James Ahrens and Patricia Fasel and Chung-Hsing Hsu and Salman Habib and Adrian Pope},

url = {http://datascience.dsscale.org/wp-content/uploads/2016/06/AnalyzingAndVisualizingCosmologicalSimulationsWithParaView.pdf},

year  = {2011},

date = {2011-01-01},

journal = {The Astrophysical Journal Supplement Series},

volume = {195},

number = {1},

pages = {11},

publisher = {IOP Publishing},

abstract = {The advent of large cosmological sky surveys – ushering in the era of precision cosmology – has been accompanied by ever larger cosmological simulations. The analysis of these simulations, which currently encompass tens of billions of particles and up to trillion particles in the near future, is often as daunting as carrying out the simulations in the first place. Therefore, the development of very efficient analysis tools combining qualitative and quantitative capabilities is a matter of some urgency. In this paper we introduce new analysis features implemented within ParaView, a parallel, open-source visualization toolkit, to analyze large N-body simulations. The new features include particle readers and a very efficient halo finder which identifies friends-of-friends halos and determines common halo properties. In combination with many other functionalities already existing within ParaView, such as histogram routines or interfaces to Python, this enhanced version enables fast, interactive, and convenient analyses of large cosmological simulations. In addition, development paths are available for future extensions.},

note = {LA-UR-10-06301},

keywords = {},

pubstate = {published},

tppubtype = {article}

}
Patchett, John; Ahrens, James; Ahern, Sean; Pugmire, David
Parallel visualization and analysis with ParaView on a Cray Xt4 Journal Article
In: Cray User Group, 2009, (LA-UR-10-02238).
@article{patchett2009parallel,

title = {Parallel visualization and analysis with ParaView on a Cray Xt4},

author = {John Patchett and James Ahrens and Sean Ahern and David Pugmire},

url = {http://datascience.dsscale.org/wp-content/uploads/2016/06/ParallelVisualizationAndAnalysisWithParaViewOnACrayXT4.pdf},

year  = {2009},

date = {2009-01-01},

journal = {Cray User Group},

abstract = {Scientific data sets produced by modern supercomputers like ORNL’s Cray XT 4, Jaguar, can be extremely large, making visualization and analysis more difficult as moving large resultant data to dedicated analysis systems can be pro- hibitively expensive. We share our continuing work of integrating a parallel visu- alization system, ParaView, on ORNL’s Jaguar system and our efforts to enable extreme scale interactive data visualization and analysis. We will discuss porting challenges and present performance numbers.},

note = {LA-UR-10-02238},

keywords = {},

pubstate = {published},

tppubtype = {article}

}
Ahrens, James; Geveci, Berk; Law, Charles
ParaView: An End-User Tool for Large-Data Visualization Journal Article
In: The Visualization Handbook, pp. 717, 2005, (LA-UR-03-1560).
@article{ahrens200536,

title = {ParaView: An End-User Tool for Large-Data Visualization},

author = {James Ahrens and Berk Geveci and Charles Law},

url = {http://datascience.dsscale.org/wp-content/uploads/2016/06/ParaView.pdf},

year  = {2005},

date = {2005-01-01},

journal = {The Visualization Handbook},

pages = {717},

publisher = {Citeseer},

abstract = {This paper describes the design and features of a visualization tool, called ParaViewi, a tool for scientists to visualize and analysis extremely large data sets. The tool provides a graphical user interface for the creation and dynamic execution of visualization tasks. ParaView transparently supports the visualization and rendering of large data sets by executing these programs in parallel on shared or distributed memory machines. ParaView supports hardware-accelerated parallel rendering and achieves interactive rendering performance via level-of-detail techniques. The design balances and integrates a number of diverse requirements including the ability to handle large data, ease of use and extensibility by developers. This paper describes the requirements that guided the design, identifies their importance to scientific users, and discusses key design decision and tradeoffs.},

note = {LA-UR-03-1560},

keywords = {},

pubstate = {published},

tppubtype = {article}

}