2018
Vogel, Sven; Biwer, Chris; Rogers, David; Ahrens, James; Hackenberg, Robert; Onken, Drew; Zhang, Jianzhong
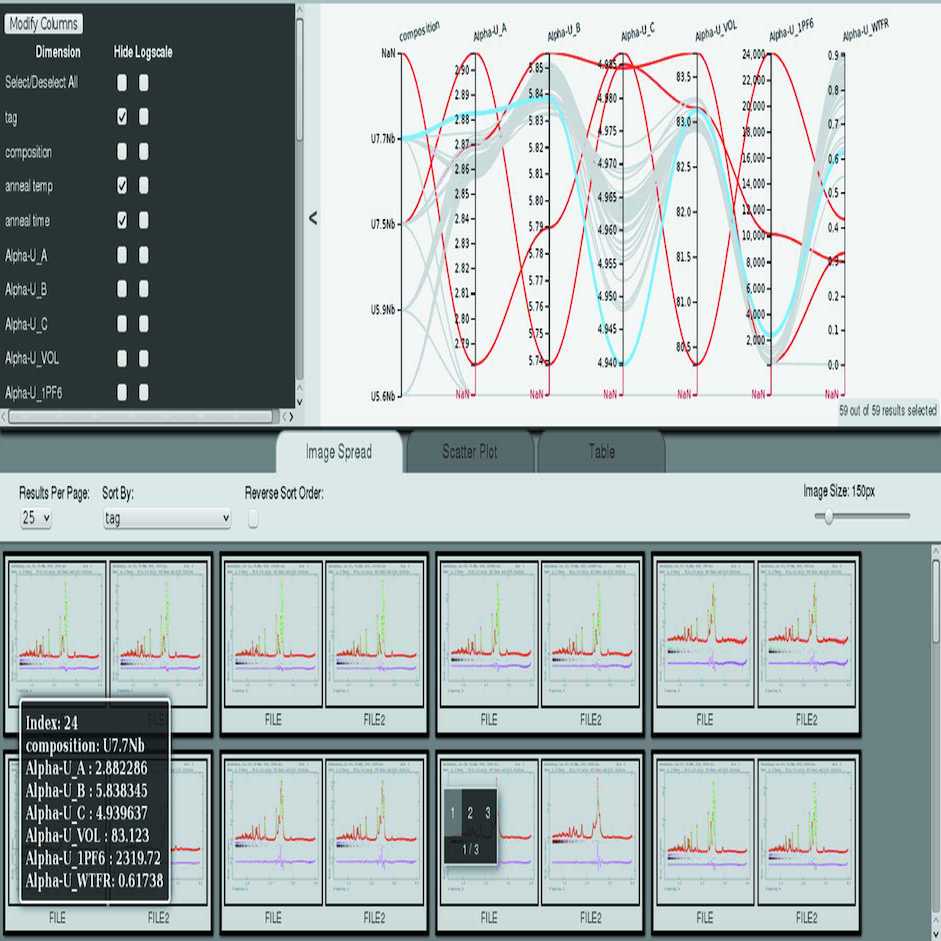
Interactive visualization of multi-data-set Rietveld analyses using Cinema:Debye-Scherrer Journal Article
In: Journal of Applied Crystallography, vol. 51, no. 3, pp. 943–951, 2018.
Abstract | Links | BibTeX | Tags: automated analysis, diffraction data analysis, visualization
@article{Vogel:ks5597,

title = {Interactive visualization of multi-data-set Rietveld analyses using \textit{Cinema:Debye-Scherrer}},

author = {Sven Vogel and Chris Biwer and David Rogers and James Ahrens and Robert Hackenberg and Drew Onken and Jianzhong Zhang},

url = {https://doi.org/10.1107/S1600576718003989},

doi = {10.1107/S1600576718003989},

year  = {2018},

date = {2018-06-01},

journal = {Journal of Applied Crystallography},

volume = {51},

number = {3},

pages = {943--951},

abstract = {A tool named \textit{Cinema:Debye-Scherrer} to visualize the results of a series of Rietveld analyses is presented. The multi-axis visualization of the high-dimensional data sets resulting from powder diffraction analyses allows identification of analysis problems, prediction of suitable starting values, identification of gaps in the experimental parameter space and acceleration of scientific insight from the experimental data. The tool is demonstrated with analysis results from 59 U—Nb alloy samples with different compositions, annealing times and annealing temperatures as well as with a high-temperature study of the crystal structure of CsPbBr_{3}. A script to extract parameters from a series of Rietveld analyses employing the widely used \textit{GSAS} Rietveld software is also described. Both software tools are available for download.},

keywords = {automated analysis, diffraction data analysis, visualization},

pubstate = {published},

tppubtype = {article}

}
A tool named Cinema:Debye-Scherrer to visualize the results of a series of Rietveld analyses is presented. The multi-axis visualization of the high-dimensional data sets resulting from powder diffraction analyses allows identification of analysis problems, prediction of suitable starting values, identification of gaps in the experimental parameter space and acceleration of scientific insight from the experimental data. The tool is demonstrated with analysis results from 59 U—Nb alloy samples with different compositions, annealing times and annealing temperatures as well as with a high-temperature study of the crystal structure of CsPbBr3. A script to extract parameters from a series of Rietveld analyses employing the widely used GSAS Rietveld software is also described. Both software tools are available for download.
: . .
1.
Vogel, Sven; Biwer, Chris; Rogers, David; Ahrens, James; Hackenberg, Robert; Onken, Drew; Zhang, Jianzhong
Interactive visualization of multi-data-set Rietveld analyses using Cinema:Debye-Scherrer Journal Article
In: Journal of Applied Crystallography, vol. 51, no. 3, pp. 943–951, 2018.
@article{Vogel:ks5597,

title = {Interactive visualization of multi-data-set Rietveld analyses using \textit{Cinema:Debye-Scherrer}},

author = {Sven Vogel and Chris Biwer and David Rogers and James Ahrens and Robert Hackenberg and Drew Onken and Jianzhong Zhang},

url = {https://doi.org/10.1107/S1600576718003989},

doi = {10.1107/S1600576718003989},

year  = {2018},

date = {2018-06-01},

journal = {Journal of Applied Crystallography},

volume = {51},

number = {3},

pages = {943--951},

abstract = {A tool named \textit{Cinema:Debye-Scherrer} to visualize the results of a series of Rietveld analyses is presented. The multi-axis visualization of the high-dimensional data sets resulting from powder diffraction analyses allows identification of analysis problems, prediction of suitable starting values, identification of gaps in the experimental parameter space and acceleration of scientific insight from the experimental data. The tool is demonstrated with analysis results from 59 U—Nb alloy samples with different compositions, annealing times and annealing temperatures as well as with a high-temperature study of the crystal structure of CsPbBr_{3}. A script to extract parameters from a series of Rietveld analyses employing the widely used \textit{GSAS} Rietveld software is also described. Both software tools are available for download.},

keywords = {},

pubstate = {published},

tppubtype = {article}

}
A tool named Cinema:Debye-Scherrer to visualize the results of a series of Rietveld analyses is presented. The multi-axis visualization of the high-dimensional data sets resulting from powder diffraction analyses allows identification of analysis problems, prediction of suitable starting values, identification of gaps in the experimental parameter space and acceleration of scientific insight from the experimental data. The tool is demonstrated with analysis results from 59 U—Nb alloy samples with different compositions, annealing times and annealing temperatures as well as with a high-temperature study of the crystal structure of CsPbBr3. A script to extract parameters from a series of Rietveld analyses employing the widely used GSAS Rietveld software is also described. Both software tools are available for download.