2015
Woodring, Jonathan; Petersen, Mark; Schmeiber, Andre; Patchett, John; Ahrens, James; Hagen, Hans
In Situ Eddy Analysis in a High-Resolution Ocean Climate Model Proceedings Article
In: IEEE, 2015, (LA-UR-pending).
Abstract | Links | BibTeX | Tags: climate modeling, collaborative development, feature analysis, feature extraction, high performance computing, In situ analysis, mesoscale eddies, ocean modeling, online analysis, revision control, simulation, software engineering, supercomputing
@inproceedings{Woodring2015,
title = {In Situ Eddy Analysis in a High-Resolution Ocean Climate Model},
author = {Jonathan Woodring and Mark Petersen and Andre Schmeiber and John Patchett and James Ahrens and Hans Hagen},
url = {http://ieeexplore.ieee.org/document/7192723/},
year = {2015},
date = {2015-01-01},
publisher = {IEEE},
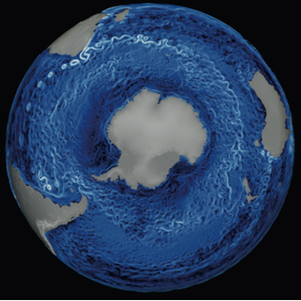
abstract = {An eddy is a feature associated with a rotating body of fluid, surrounded by a ring of shearing fluid. In the ocean, eddies are 10 to 150 km in diameter, are spawned by boundary currents and baroclinic instabilities, may live for hundreds of days, and travel for hundreds of kilometers. Eddies are important in climate studies because they transport heat, salt, and nutrients through the world’s oceans and are vessels of biological productivity. The study of eddies in global ocean-climate models requires large-scale, high-resolution simulations. This poses a problem for feasible (timely) eddy analysis, as ocean simulations generate massive amounts of data, causing a bottleneck for traditional analysis workflows. To enable eddy studies, we have developed an in situ workflow for the quantitative and qualitative analysis of MPAS-Ocean, a high-resolution ocean climate model, in collaboration with the ocean model research and development process. Planned eddy analysis at high spatial and temporal resolutions will not be possible with a post- processing workflow due to various constraints, such as storage size and I/O time, but the in situ workflow enables it and scales well to ten-thousand processing elements.},
note = {LA-UR-pending},
keywords = {climate modeling, collaborative development, feature analysis, feature extraction, high performance computing, In situ analysis, mesoscale eddies, ocean modeling, online analysis, revision control, simulation, software engineering, supercomputing},
pubstate = {published},
tppubtype = {inproceedings}
}
1998
McCormick, Patrick; Ahrens, James
Visualization of wildfire simulations Journal Article
In: Computer Graphics and Applications, IEEE, vol. 18, no. 2, pp. 17–19, 1998, (LA-UR-98-0646).
Abstract | Links | BibTeX | Tags: simulation, simulation output analysis, wildfire
@article{mccormick1998visualization,
title = {Visualization of wildfire simulations},
author = {Patrick McCormick and James Ahrens },
url = {http://datascience.dsscale.org/wp-content/uploads/2016/06/VisualizationOfWildfireSimulations.pdf},
year = {1998},
date = {1998-01-01},
journal = {Computer Graphics and Applications, IEEE},
volume = {18},
number = {2},
pages = {17--19},
publisher = {IEEE},
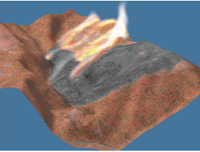
abstract = {Newspaper headlines constantly remind us of the human and property losses we suffer from wildfires, severe storms, earthquakes, and other natural disasters. These disasters cost the United States hundreds of lives and billions of dollars annually. Scientists at Los Alamos National Laboratory are developing computer models to predict the evolution of such disasters. Predicting the course of these events in faster than real time permits developing management strategies to minimize their adverse consequences. Presently, the complexity of models that forecast crises requires the advanced computing systems available at Los Alamos. In the near future, these models will be adapted for use in planning, training, and operational situations, but will still require advanced computing systems to run.},
note = {LA-UR-98-0646},
keywords = {simulation, simulation output analysis, wildfire},
pubstate = {published},
tppubtype = {article}
}
1997
Ahrens, James; McCormick, Patrick; Bossert, James; Reisner, Jon; Winterkamp, Judith
Case study: Wildfire visualization Proceedings Article
In: Visualization'97., Proceedings, pp. 451–454, IEEE 1997, (LA-UR-97-2761).
Abstract | Links | BibTeX | Tags: simulation, simulation output analysis, wildfire
@inproceedings{ahrens1997case,
title = {Case study: Wildfire visualization},
author = {James Ahrens and Patrick McCormick and James Bossert and Jon Reisner and Judith Winterkamp},
url = {http://datascience.dsscale.org/wp-content/uploads/2016/06/CaseStudyWildfireVisualization.pdf},
year = {1997},
date = {1997-01-01},
booktitle = {Visualization'97., Proceedings},
pages = {451--454},
organization = {IEEE},
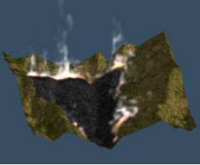
abstract = {The ability to forecast the progress of crisis events would significantly reduce human suffering and loss of life, the destruction of property, and expenditures for assessment and recovery. Los Alamos National Laboratory has established a scientific thrust in crisis forecasting to address this national challenge. In the initial phase of this project, scientists at Los Alamos are developing computer models to predict the spread of a wildfire. Visualization of the results of the wildfire simulation will be used by scientists to assess the quality of the simulation and eventually by fire personnel as a visual forecast of the wildfire’s evolution. The fire personnel and scientists want the visualization to look as realistic as possible without compromising scientific accuracy. This paper describes how the visualization was created, analyzes the tools and approach that was used, and suggests directions for future work and research.},
note = {LA-UR-97-2761},
keywords = {simulation, simulation output analysis, wildfire},
pubstate = {published},
tppubtype = {inproceedings}
}
Woodring, Jonathan; Petersen, Mark; Schmeiber, Andre; Patchett, John; Ahrens, James; Hagen, Hans
In Situ Eddy Analysis in a High-Resolution Ocean Climate Model Proceedings Article
In: IEEE, 2015, (LA-UR-pending).
@inproceedings{Woodring2015,

title = {In Situ Eddy Analysis in a High-Resolution Ocean Climate Model},

author = {Jonathan Woodring and Mark Petersen and Andre Schmeiber and John Patchett and James Ahrens and Hans Hagen},

url = {http://ieeexplore.ieee.org/document/7192723/},

year  = {2015},

date = {2015-01-01},

publisher = {IEEE},

abstract = {An eddy is a feature associated with a rotating body of fluid, surrounded by a ring of shearing fluid. In the ocean, eddies are 10 to 150 km in diameter, are spawned by boundary currents and baroclinic instabilities, may live for hundreds of days, and travel for hundreds of kilometers. Eddies are important in climate studies because they transport heat, salt, and nutrients through the world’s oceans and are vessels of biological productivity. The study of eddies in global ocean-climate models requires large-scale, high-resolution simulations. This poses a problem for feasible (timely) eddy analysis, as ocean simulations generate massive amounts of data, causing a bottleneck for traditional analysis workflows. To enable eddy studies, we have developed an in situ workflow for the quantitative and qualitative analysis of MPAS-Ocean, a high-resolution ocean climate model, in collaboration with the ocean model research and development process. Planned eddy analysis at high spatial and temporal resolutions will not be possible with a post- processing workflow due to various constraints, such as storage size and I/O time, but the in situ workflow enables it and scales well to ten-thousand processing elements.},

note = {LA-UR-pending},

keywords = {},

pubstate = {published},

tppubtype = {inproceedings}

}
McCormick, Patrick; Ahrens, James
Visualization of wildfire simulations Journal Article
In: Computer Graphics and Applications, IEEE, vol. 18, no. 2, pp. 17–19, 1998, (LA-UR-98-0646).
@article{mccormick1998visualization,

title = {Visualization of wildfire simulations},

author = {Patrick McCormick and James Ahrens },

url = {http://datascience.dsscale.org/wp-content/uploads/2016/06/VisualizationOfWildfireSimulations.pdf},

year  = {1998},

date = {1998-01-01},

journal = {Computer Graphics and Applications, IEEE},

volume = {18},

number = {2},

pages = {17--19},

publisher = {IEEE},

abstract = {Newspaper headlines constantly remind us of the human and property losses we suffer from wildfires, severe storms, earthquakes, and other natural disasters. These disasters cost the United States hundreds of lives and billions of dollars annually. Scientists at Los Alamos National Laboratory are developing computer models to predict the evolution of such disasters. Predicting the course of these events in faster than real time permits developing management strategies to minimize their adverse consequences. Presently, the complexity of models that forecast crises requires the advanced computing systems available at Los Alamos. In the near future, these models will be adapted for use in planning, training, and operational situations, but will still require advanced computing systems to run.},

note = {LA-UR-98-0646},

keywords = {},

pubstate = {published},

tppubtype = {article}

}
Ahrens, James; McCormick, Patrick; Bossert, James; Reisner, Jon; Winterkamp, Judith
Case study: Wildfire visualization Proceedings Article
In: Visualization'97., Proceedings, pp. 451–454, IEEE 1997, (LA-UR-97-2761).
@inproceedings{ahrens1997case,

title = {Case study: Wildfire visualization},

author = {James Ahrens and Patrick McCormick and James Bossert and Jon Reisner and Judith Winterkamp},

url = {http://datascience.dsscale.org/wp-content/uploads/2016/06/CaseStudyWildfireVisualization.pdf},

year  = {1997},

date = {1997-01-01},

booktitle = {Visualization'97., Proceedings},

pages = {451--454},

organization = {IEEE},

abstract = {The ability to forecast the progress of crisis events would significantly reduce human suffering and loss of life, the destruction of property, and expenditures for assessment and recovery. Los Alamos National Laboratory has established a scientific thrust in crisis forecasting to address this national challenge. In the initial phase of this project, scientists at Los Alamos are developing computer models to predict the spread of a wildfire. Visualization of the results of the wildfire simulation will be used by scientists to assess the quality of the simulation and eventually by fire personnel as a visual forecast of the wildfire’s evolution. The fire personnel and scientists want the visualization to look as realistic as possible without compromising scientific accuracy. This paper describes how the visualization was created, analyzes the tools and approach that was used, and suggests directions for future work and research.},

note = {LA-UR-97-2761},

keywords = {},

pubstate = {published},

tppubtype = {inproceedings}

}