2015
Ahrens, James
Increasing Scientific Data Insights about Exascale Class Simulations under Power and Storage Constraints Journal Article
In: vol. 35, no. 2, pp. 8–11, 2015, ISSN: 0272-1716 (print), 1558-1756 (electronic), (LA-UR-pending).
Abstract | Links | BibTeX | Tags: exascale, increasing scientific data insights
@article{Ahrens:2015:ISD,

title = {Increasing Scientific Data Insights about Exascale Class Simulations under Power and Storage Constraints},

author = {James Ahrens},

url = {https://datascience.dsscale.org/wp-content/uploads/2016/06/IncreasingScientificDataInsightsAboutExascaleClassSimulationsUnderPowerAndStorageConstrains.pdf},

issn = {0272-1716 (print), 1558-1756 (electronic)},

year  = {2015},

date = {2015-00-01},

volume = {35},

number = {2},

pages = {8--11},

abstract = {Over the past three decades, supercomputing systems have progressed to compute the results of extremely accurate scientific simulations. These simulations help us understand complex real-world phenomena such as our climate, energy sources, and the progression of natual disasters. Additionally, computing power supports the computation of hither-quality simulations, and that in turn provides higher fidelity results. Using the number of floating-point operations per second (flops) as a measure of progress, we have progressed through terascale machines that compute 10**12 flops to petascale machines that compute 10**15 flops. A number of open source efforts provide a robust scalable visualization and analysis capability such as ParaView (www.paraview.org) and Visit (https://visit.llnl.gov) for these levels of performance. These tools traditionally focus on a postprocessing approach. That is, during a simulation run, representative results are written to storage for later visualization. ...continued in full paper below.},

note = {LA-UR-pending},

keywords = {exascale, increasing scientific data insights},

pubstate = {published},

tppubtype = {article}

}
2014

Ahrens, James
Increasing Scientific Data Insights About Exascale Class Simulations Under Power and Storage Constraints Presentation
28.02.2014, (LA-UR-pending).
Abstract | Links | BibTeX | Tags: exascale
@misc{Ahrens2014b,

title = {Increasing Scientific Data Insights About Exascale Class Simulations Under Power and Storage Constraints},

author = {James Ahrens},

url = {http://datascience.dsscale.org/wp-content/uploads/2016/06/IncreasingScientificDataInsightsAboutExascaleClassSimulationsUnderPowerAndStorageConstrains.pdf

http://www.exascale.org/bdec/},

year  = {2014},

date = {2014-02-28},

abstract = {James Ahrens gave an invited talk and led data sessions at the Big Data and Extreme-Scale Computing Conference in Fukuoka, Japan from Feb. 26-28, 2014. The title of Jim's talk was 'Increasing Scientific Data Insights About Exascale Class Simulations Under Power and Storage Constraints'. Jim also described the talk in a podcast interview with HPCWire.},

note = {LA-UR-pending},

keywords = {exascale},

pubstate = {published},

tppubtype = {presentation}

}
2011
Ahrens, James; Rogers, David; Springmeyer, Becky; Brugger, Eric; Crossno, Patricia; Jiang, Ming; Harrison, Cyrus; Monroe, Laura; Tomlinson, Bob; Pavlakos, Dino; Childs, Hank; Klasky, Scott; Ma, Kwan-Liu
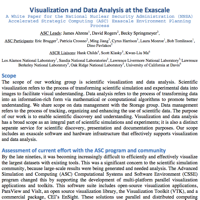
Visualization and data analysis at the exascale Technical Report
Los Alamos National Laboratory (LANL) 2011, (LLNL-TR-474731).
Abstract | Links | BibTeX | Tags: exascale, visualization and data analysis
@techreport{ahrens2011visualization,

title = {Visualization and data analysis at the exascale},

author = {James Ahrens and David Rogers and Becky Springmeyer and Eric Brugger and Patricia Crossno and Ming Jiang and Cyrus Harrison and Laura Monroe and Bob Tomlinson and Dino Pavlakos and Hank Childs and Scott Klasky and Kwan-Liu Ma},

url = {http://datascience.dsscale.org/wp-content/uploads/2016/06/VisualizationAndDataAnalysisAtTheExascale.pdf},

year  = {2011},

date = {2011-01-01},

institution = {Los Alamos National Laboratory (LANL)},

abstract = {The scope of our working group is scientific visualization and data analysis. Scientific visualization refers to the process of transforming scientific simulation and experimental data into images to facilitate visual understanding. Data analys is refers to the process of transforming data into an information-rich form via mathematical or computational algorithms to promote better understanding. We share scope on data management with the Storage group. Data management refers to the process of tracking, organizing and enhancing the use of scientific data. The purpose of our work is to enable scientific discovery and understanding. Visualization and data analysis has a broad scope as an integral part of scientific simulations and experiments; it is also a distinct separate service for scientific discovery, presen tation and documentation purposes. Our scope includes an exascale software and hardware infrastru cture that effectively supports visualization and data analysis.},

note = {LLNL-TR-474731},

keywords = {exascale, visualization and data analysis},

pubstate = {published},

tppubtype = {techreport}

}
2010
Patchett, John; Ahrens, James; Lo, Li-Ta; Browniee, Carson; Mitchell, Christopher; Hansen, Chuck
Approaching the Exa-Scale: a Real-World Evaluation of Rendering Extremely Large Data Sets Journal Article
In: 2010.
Abstract | Links | BibTeX | Tags: exascale, large-scale data
@article{Patchett_Ahrens_Lo_Browniee_Mitchell_Hansen_2010,

title = {Approaching the Exa-Scale: a Real-World Evaluation of Rendering Extremely Large Data Sets},

author = {John Patchett and James Ahrens and Li-Ta Lo and Carson Browniee and Christopher Mitchell and Chuck Hansen},

url = {http://datascience.dsscale.org/wp-content/uploads/2017/09/LA-UR-10-07016.pdf},

year  = {2010},

date = {2010-10-01},

abstract = {Extremely large scale analysis is becoming increasingly important as supercomputers and their simulations move from petascale to exascale. The lack of dedicated hardware acceleration for rendering on today’s supercomputing platforms motivates our detailed evaluation of the possibility of interactive rendering on the supercomputer. In order to facilitate our understanding of rendering on the supercomputing platform, we focus on scalability of rendering algorithms and architecture envisioned for exascale datasets. To understand tradeoffs for dealing with extremely large datasets, we compare three different rendering algorithms for large polygonal data: software based ray tracing, software based rasterization and hardware accelerated rasterization. We present a case study of strong and weak scaling of rendering extremely large data on both GPU and CPU based parallel supercomputers using Para View, a parallel visualization tool. We use three different data sets: two synthetic and one from a scientific application. At an extreme scale, algorithmic rendering choices make a difference and should be considered while approaching exascale computing, visualization, and analysis. We find software based ray-tracing offers a viable approach for scalable rendering of the projected future massive data sizes.},

keywords = {exascale, large-scale data},

pubstate = {published},

tppubtype = {article}

}
Ahrens, James
Increasing Scientific Data Insights about Exascale Class Simulations under Power and Storage Constraints Journal Article
In: vol. 35, no. 2, pp. 8–11, 2015, ISSN: 0272-1716 (print), 1558-1756 (electronic), (LA-UR-pending).
@article{Ahrens:2015:ISD,

title = {Increasing Scientific Data Insights about Exascale Class Simulations under Power and Storage Constraints},

author = {James Ahrens},

url = {https://datascience.dsscale.org/wp-content/uploads/2016/06/IncreasingScientificDataInsightsAboutExascaleClassSimulationsUnderPowerAndStorageConstrains.pdf},

issn = {0272-1716 (print), 1558-1756 (electronic)},

year  = {2015},

date = {2015-00-01},

volume = {35},

number = {2},

pages = {8--11},

abstract = {Over the past three decades, supercomputing systems have progressed to compute the results of extremely accurate scientific simulations. These simulations help us understand complex real-world phenomena such as our climate, energy sources, and the progression of natual disasters. Additionally, computing power supports the computation of hither-quality simulations, and that in turn provides higher fidelity results. Using the number of floating-point operations per second (flops) as a measure of progress, we have progressed through terascale machines that compute 10**12 flops to petascale machines that compute 10**15 flops. A number of open source efforts provide a robust scalable visualization and analysis capability such as ParaView (www.paraview.org) and Visit (https://visit.llnl.gov) for these levels of performance. These tools traditionally focus on a postprocessing approach. That is, during a simulation run, representative results are written to storage for later visualization. ...continued in full paper below.},

note = {LA-UR-pending},

keywords = {},

pubstate = {published},

tppubtype = {article}

}
Ahrens, James
Increasing Scientific Data Insights About Exascale Class Simulations Under Power and Storage Constraints Presentation
28.02.2014, (LA-UR-pending).
@misc{Ahrens2014b,

title = {Increasing Scientific Data Insights About Exascale Class Simulations Under Power and Storage Constraints},

author = {James Ahrens},

url = {http://datascience.dsscale.org/wp-content/uploads/2016/06/IncreasingScientificDataInsightsAboutExascaleClassSimulationsUnderPowerAndStorageConstrains.pdf

http://www.exascale.org/bdec/},

year  = {2014},

date = {2014-02-28},

abstract = {James Ahrens gave an invited talk and led data sessions at the Big Data and Extreme-Scale Computing Conference in Fukuoka, Japan from Feb. 26-28, 2014. The title of Jim's talk was 'Increasing Scientific Data Insights About Exascale Class Simulations Under Power and Storage Constraints'. Jim also described the talk in a podcast interview with HPCWire.},

note = {LA-UR-pending},

keywords = {},

pubstate = {published},

tppubtype = {presentation}

}
Ahrens, James; Rogers, David; Springmeyer, Becky; Brugger, Eric; Crossno, Patricia; Jiang, Ming; Harrison, Cyrus; Monroe, Laura; Tomlinson, Bob; Pavlakos, Dino; Childs, Hank; Klasky, Scott; Ma, Kwan-Liu
Visualization and data analysis at the exascale Technical Report
Los Alamos National Laboratory (LANL) 2011, (LLNL-TR-474731).
@techreport{ahrens2011visualization,

title = {Visualization and data analysis at the exascale},

author = {James Ahrens and David Rogers and Becky Springmeyer and Eric Brugger and Patricia Crossno and Ming Jiang and Cyrus Harrison and Laura Monroe and Bob Tomlinson and Dino Pavlakos and Hank Childs and Scott Klasky and Kwan-Liu Ma},

url = {http://datascience.dsscale.org/wp-content/uploads/2016/06/VisualizationAndDataAnalysisAtTheExascale.pdf},

year  = {2011},

date = {2011-01-01},

institution = {Los Alamos National Laboratory (LANL)},

abstract = {The scope of our working group is scientific visualization and data analysis. Scientific visualization refers to the process of transforming scientific simulation and experimental data into images to facilitate visual understanding. Data analys is refers to the process of transforming data into an information-rich form via mathematical or computational algorithms to promote better understanding. We share scope on data management with the Storage group. Data management refers to the process of tracking, organizing and enhancing the use of scientific data. The purpose of our work is to enable scientific discovery and understanding. Visualization and data analysis has a broad scope as an integral part of scientific simulations and experiments; it is also a distinct separate service for scientific discovery, presen tation and documentation purposes. Our scope includes an exascale software and hardware infrastru cture that effectively supports visualization and data analysis.},

note = {LLNL-TR-474731},

keywords = {},

pubstate = {published},

tppubtype = {techreport}

}
Patchett, John; Ahrens, James; Lo, Li-Ta; Browniee, Carson; Mitchell, Christopher; Hansen, Chuck
Approaching the Exa-Scale: a Real-World Evaluation of Rendering Extremely Large Data Sets Journal Article
In: 2010.
@article{Patchett_Ahrens_Lo_Browniee_Mitchell_Hansen_2010,

title = {Approaching the Exa-Scale: a Real-World Evaluation of Rendering Extremely Large Data Sets},

author = {John Patchett and James Ahrens and Li-Ta Lo and Carson Browniee and Christopher Mitchell and Chuck Hansen},

url = {http://datascience.dsscale.org/wp-content/uploads/2017/09/LA-UR-10-07016.pdf},

year  = {2010},

date = {2010-10-01},

abstract = {Extremely large scale analysis is becoming increasingly important as supercomputers and their simulations move from petascale to exascale. The lack of dedicated hardware acceleration for rendering on today’s supercomputing platforms motivates our detailed evaluation of the possibility of interactive rendering on the supercomputer. In order to facilitate our understanding of rendering on the supercomputing platform, we focus on scalability of rendering algorithms and architecture envisioned for exascale datasets. To understand tradeoffs for dealing with extremely large datasets, we compare three different rendering algorithms for large polygonal data: software based ray tracing, software based rasterization and hardware accelerated rasterization. We present a case study of strong and weak scaling of rendering extremely large data on both GPU and CPU based parallel supercomputers using Para View, a parallel visualization tool. We use three different data sets: two synthetic and one from a scientific application. At an extreme scale, algorithmic rendering choices make a difference and should be considered while approaching exascale computing, visualization, and analysis. We find software based ray-tracing offers a viable approach for scalable rendering of the projected future massive data sizes.},

keywords = {},

pubstate = {published},

tppubtype = {article}

}