2017
Dutta, Soumya; Woodring, Jon; Shen, Han-Wei; Chen, Jen-Ping; Ahrens, James
Homogeneity guided probabilistic data summaries for analysis and visualization of large-scale data sets Proceedings Article
In: 2017 IEEE Pacific Visualization Symposium (PacificVis), pp. 111-120, 2017, ISSN: 2165-8773, (LA-UR-18-27370).
Abstract | Links | BibTeX | Tags: data visualization, picture/image generation, statistical computing
@inproceedings{8031585,
title = {Homogeneity guided probabilistic data summaries for analysis and visualization of large-scale data sets},
author = {Soumya Dutta and Jon Woodring and Han-Wei Shen and Jen-Ping Chen and James Ahrens},
url = {https://datascience.dsscale.org/wp-content/uploads/2018/08/la-ur_18-27370.pdf},
doi = {10.1109/PACIFICVIS.2017.8031585},
issn = {2165-8773},
year = {2017},
date = {2017-04-01},
booktitle = {2017 IEEE Pacific Visualization Symposium (PacificVis)},
pages = {111-120},
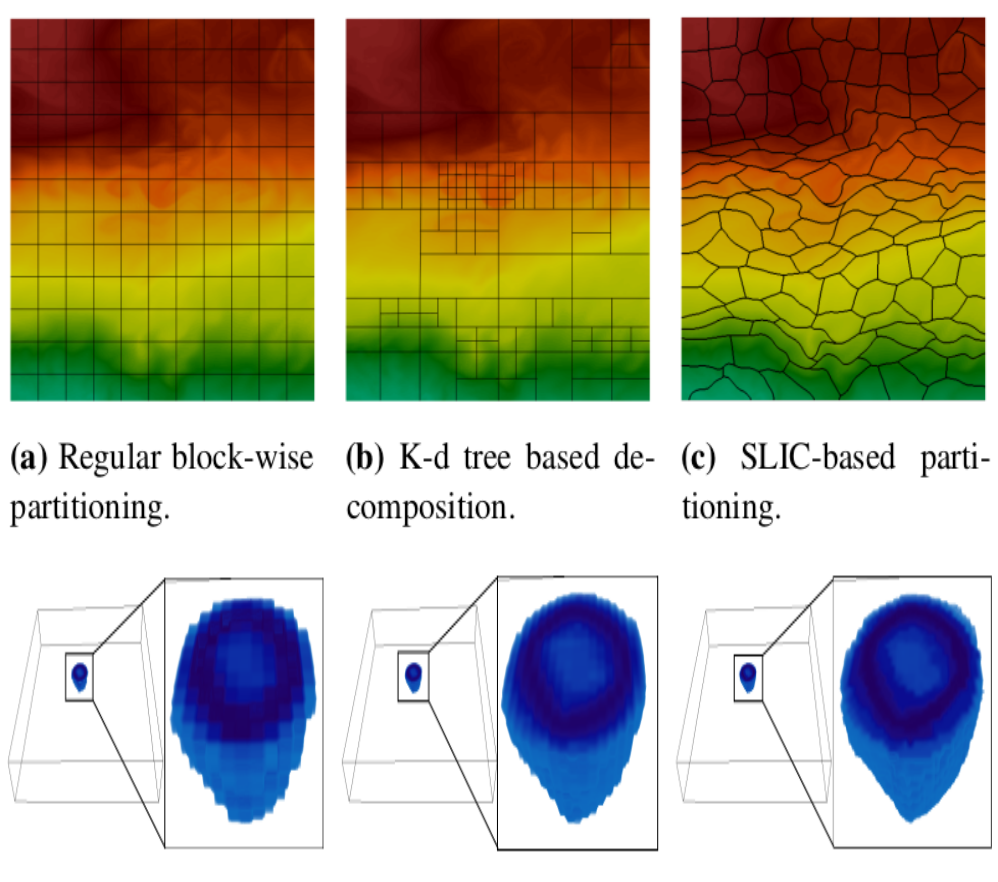
abstract = {High-resolution simulation data sets provide plethora of information, which needs to be explored by application scientists to gain enhanced understanding about various phenomena. Visual-analytics techniques using raw data sets are often expensive due to the data sets' extreme sizes. But, interactive analysis and visualization is crucial for big data analytics, because scientists can then focus on the important data and make critical decisions quickly. To assist efficient exploration and visualization, we propose a new region-based statistical data summarization scheme. Our method is superior in quality, as compared to the existing statistical summarization techniques, with a more compact representation, reducing the overall storage cost. The quantitative and visual efficacy of our proposed method is demonstrated using several data sets along with an in situ application study for an extreme-scale flow simulation.},
note = {LA-UR-18-27370},
keywords = {data visualization, picture/image generation, statistical computing},
pubstate = {published},
tppubtype = {inproceedings}
}
2014
Nouanesengsy, Boonthanome; Woodring, Jonathan; Patchett, John; Myers, Kary; Ahrens, James
ADR visualization: A generalized framework for ranking large-scale scientific data using Analysis-Driven Refinement Proceedings Article
In: Large Data Analysis and Visualization (LDAV), 2014 IEEE 4th Symposium on, pp. 43–50, IEEE 2014, (LA-UR-pending).
Abstract | Links | BibTeX | Tags: adaptive mesh refinement, ADR, Analysis-Driven Refinement, big data, data triage, focus+context, hardware architecture, large-scale data, parallel processing, picture/image generation, prioritization, scientific data, viewing algorithms
@inproceedings{nouanesengsy2014adr,

title = {ADR visualization: A generalized framework for ranking large-scale scientific data using Analysis-Driven Refinement},

author = {Boonthanome Nouanesengsy and Jonathan Woodring and John Patchett and Kary Myers and James Ahrens},

url = {http://datascience.dsscale.org/wp-content/uploads/2016/06/ADRVisualization.pdf},

year  = {2014},

date = {2014-01-01},

booktitle = {Large Data Analysis and Visualization (LDAV), 2014 IEEE 4th Symposium on},

pages = {43--50},

organization = {IEEE},

abstract = {Prioritization of data is necessary for managing large-scale scien- tific data, as the scale of the data implies that there are only enough resources available to process a limited subset of the data. For ex- ample, data prioritization is used during in situ triage to scale with bandwidth bottlenecks, and used during focus+context visualiza- tion to save time during analysis by guiding the user to impor- tant information. In this paper, we present ADR visualization, a generalized analysis framework for ranking large-scale data using Analysis-Driven Refinement (ADR), which is inspired by Adaptive Mesh Refinement (AMR). A large-scale data set is partitioned in space, time, and variable, using user-defined importance measure- ments for prioritization. This process creates a prioritization tree over the data set. Using this tree, selection methods can generate sparse data products for analysis, such as focus+context visualiza- tions or sparse data sets.},

note = {LA-UR-pending},

keywords = {adaptive mesh refinement, ADR, Analysis-Driven Refinement, big data, data triage, focus+context, hardware architecture, large-scale data, parallel processing, picture/image generation, prioritization, scientific data, viewing algorithms},

pubstate = {published},

tppubtype = {inproceedings}

}
Dutta, Soumya; Woodring, Jon; Shen, Han-Wei; Chen, Jen-Ping; Ahrens, James
Homogeneity guided probabilistic data summaries for analysis and visualization of large-scale data sets Proceedings Article
In: 2017 IEEE Pacific Visualization Symposium (PacificVis), pp. 111-120, 2017, ISSN: 2165-8773, (LA-UR-18-27370).
@inproceedings{8031585,

title = {Homogeneity guided probabilistic data summaries for analysis and visualization of large-scale data sets},

author = {Soumya Dutta and Jon Woodring and Han-Wei Shen and Jen-Ping Chen and James Ahrens},

url = {https://datascience.dsscale.org/wp-content/uploads/2018/08/la-ur_18-27370.pdf},

doi = {10.1109/PACIFICVIS.2017.8031585},

issn = {2165-8773},

year  = {2017},

date = {2017-04-01},

booktitle = {2017 IEEE Pacific Visualization Symposium (PacificVis)},

pages = {111-120},

abstract = {High-resolution simulation data sets provide plethora of information, which needs to be explored by application scientists to gain enhanced understanding about various phenomena. Visual-analytics techniques using raw data sets are often expensive due to the data sets' extreme sizes. But, interactive analysis and visualization is crucial for big data analytics, because scientists can then focus on the important data and make critical decisions quickly. To assist efficient exploration and visualization, we propose a new region-based statistical data summarization scheme. Our method is superior in quality, as compared to the existing statistical summarization techniques, with a more compact representation, reducing the overall storage cost. The quantitative and visual efficacy of our proposed method is demonstrated using several data sets along with an in situ application study for an extreme-scale flow simulation.},

note = {LA-UR-18-27370},

keywords = {},

pubstate = {published},

tppubtype = {inproceedings}

}
Nouanesengsy, Boonthanome; Woodring, Jonathan; Patchett, John; Myers, Kary; Ahrens, James
ADR visualization: A generalized framework for ranking large-scale scientific data using Analysis-Driven Refinement Proceedings Article
In: Large Data Analysis and Visualization (LDAV), 2014 IEEE 4th Symposium on, pp. 43–50, IEEE 2014, (LA-UR-pending).
@inproceedings{nouanesengsy2014adr,

title = {ADR visualization: A generalized framework for ranking large-scale scientific data using Analysis-Driven Refinement},

author = {Boonthanome Nouanesengsy and Jonathan Woodring and John Patchett and Kary Myers and James Ahrens},

url = {http://datascience.dsscale.org/wp-content/uploads/2016/06/ADRVisualization.pdf},

year  = {2014},

date = {2014-01-01},

booktitle = {Large Data Analysis and Visualization (LDAV), 2014 IEEE 4th Symposium on},

pages = {43--50},

organization = {IEEE},

abstract = {Prioritization of data is necessary for managing large-scale scien- tific data, as the scale of the data implies that there are only enough resources available to process a limited subset of the data. For ex- ample, data prioritization is used during in situ triage to scale with bandwidth bottlenecks, and used during focus+context visualiza- tion to save time during analysis by guiding the user to impor- tant information. In this paper, we present ADR visualization, a generalized analysis framework for ranking large-scale data using Analysis-Driven Refinement (ADR), which is inspired by Adaptive Mesh Refinement (AMR). A large-scale data set is partitioned in space, time, and variable, using user-defined importance measure- ments for prioritization. This process creates a prioritization tree over the data set. Using this tree, selection methods can generate sparse data products for analysis, such as focus+context visualiza- tions or sparse data sets.},

note = {LA-UR-pending},

keywords = {},

pubstate = {published},

tppubtype = {inproceedings}

}