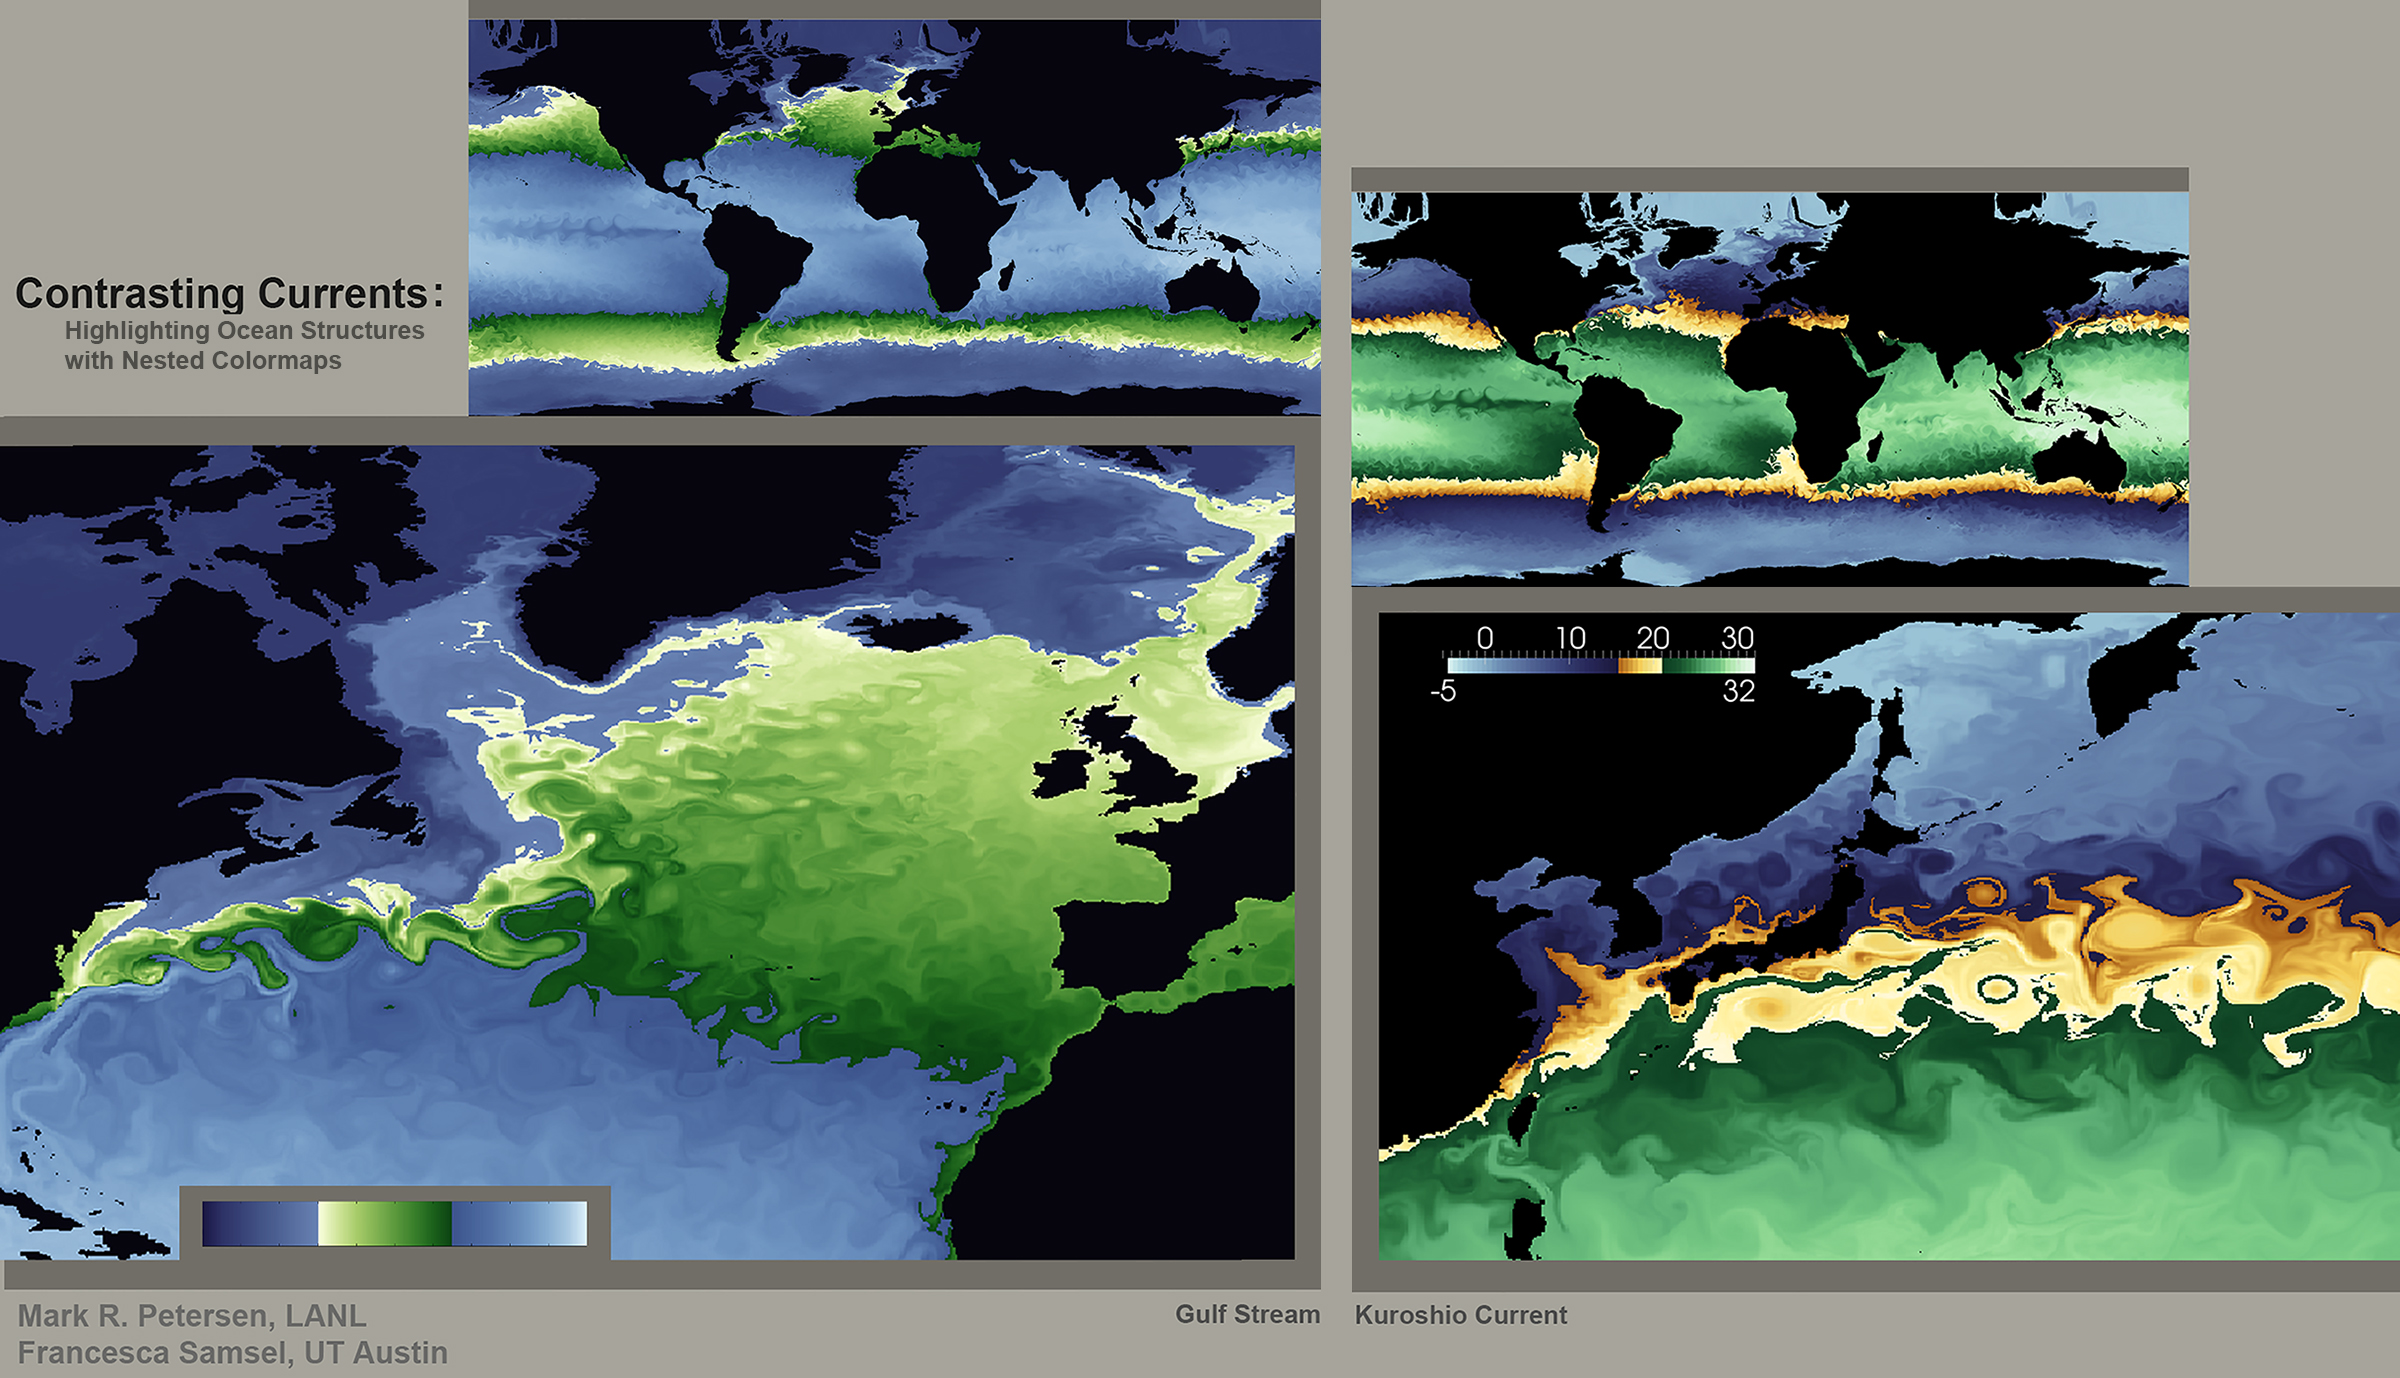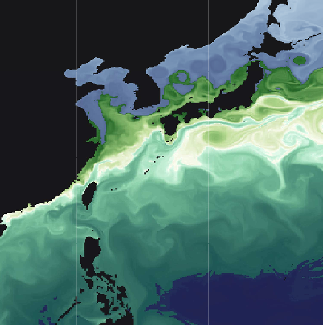
This is a visualization of ocean temperature, in degrees Celsius, from the MPAS-Ocean Model, developed at Los Alamos National Laboratory. The goal of the visualization is to enable detailed views of the eddies and currents in specific regions of the model. The color map developed allows for a detailed rendering of specific data ranges. The image of the North Atlantic shows that the Gulf Stream departs the US coast at Cape Hatteras, NC, and turns left just south of Greenland, a feature known as the ‘Northwest Corner’. This pathway compares well with observations, and is highlighted by a narrow range of greens on the colormap. In the western Pacific, the Kuroshio current is a narrow stream of warm water that sheds eddies as it departs eastward from Japan. The colormap was chosen to use light yellow at 22C at the center of the jet, highlighting cooler eddies to the north in blue and warmer eddies to the south in green. It was produced by Francesca G. Samsel of the Center for Agile Technologies at the University of Texas at Austin and Mark Petersen of the Climate, Ocean, Sea Ice Modeling Team at the Los Alamos National Laboratory.