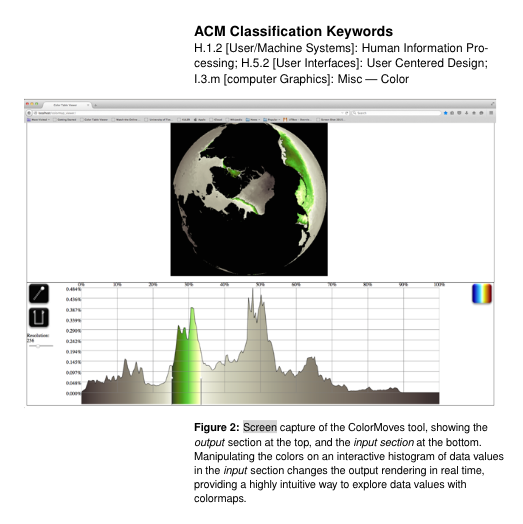
A paper authored by Francesca Samsel, Sebastian Klaasen, Mark Petersen, Terece L. Turton, Gregory Abram, David H. Rogers and James Ahrens and titled ‘Interactive Colormapping: Enabling Multiple Data Ranges, Detailed Views of Ocean Salinity‘ was presented at the CHI2016 Conference held in San Jose, California, on May 7 to 12, 2016.
