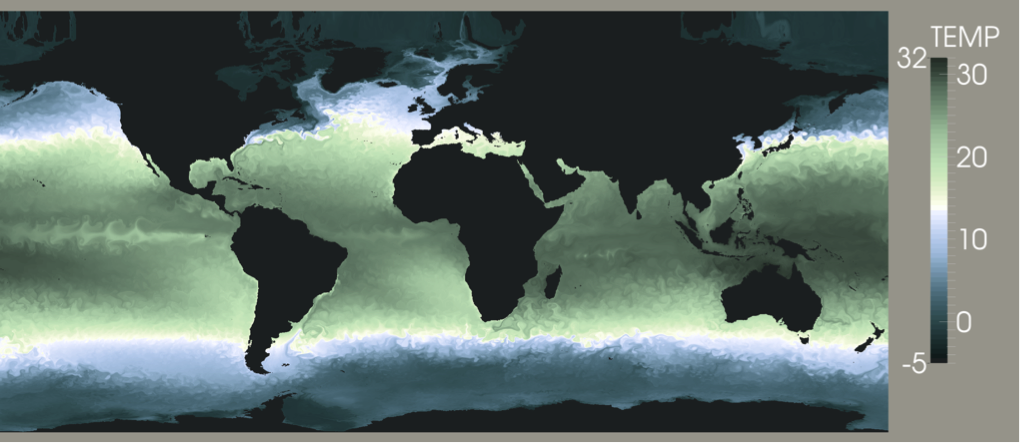
Working with COSIM climate modelers at LANL artist Francesca Samsel and the Data Science at Scale Team developed new colormaps that enable scientists to see more detail within their simulations. The colormaps move through changes in hue, saturation and value to create a longer line through colorspace. The maps have been user tested for their ability to show even and accurate detail. A number of these colormaps will be incorporated by Kitware into the next release of ParaView. The new colormaps draw a longer line through color space by independently specified H, S, and V values. Some maps have 20 control points, others over 40. Removing some control points, as long as you are adjusting in LAB space, is fine, but you will lose some of the detailed color contrast which is what makes these maps effective.
New Colormaps