2020
Childs, Hank; Ahern, Sean; Ahrens, James; Bauer, Andrew; Bennett, Janine; Bethel, Wes; Bremer, Peer-Timo; Brugger, Eric; Cottam, Joseph; Dorier, Matthieu; Dutta, Soumya; Favre, Jean; Fogal, Thomas; Frey, Steffen; Garth, Christoph; Geveci, Berk; Godoy, William; Hansen, Charles; Harrison, Cyrus; Hentschel, Bernd; Insley, Joseph; Johnson, Chris; Klasky, Scott; Knoll, Aaron; Kress, James; Larsen, Matthew; Lofstead, Jay; Ma, Kwan-Liu; Malakar, Preeti; Meredith, Jeremy; Moreland, Kenneth; Navrátil, Paul; O’Leary, Patrick; Parashar, Manish; Pascucci, Valerio; Patchett, John; Peterka, Tom; Petruzza, Steve; Podhorszki, Norbert; Pugmire, David; Rasquin, Michel; Rizzi, Silvio; Rogers, David; Sane, Sudhanshu; Sauer, Franz; Sisneros, Robert; Shen, Han-Wei; Usher, Will; Vickery, Rhonda; Vishwanath, Venkatram; Wald, Ingo; Wang, Ruonan; Weber, Gunther; Whitlock, Brad; Wolf, Matthew; Yu, Hongfeng; Ziegeler, Sean
A terminology for in situ visualization and analysis systems Journal Article
In: The International Journal of High Performance Computing Applications, vol. 34, no. 6, pp. 676-691, 2020.
Abstract | Links | BibTeX | Tags: in situ processing, scientific visualization
@article{doi:10.1177/1094342020935991,
title = {A terminology for in situ visualization and analysis systems},
author = {Hank Childs and Sean Ahern and James Ahrens and Andrew Bauer and Janine Bennett and Wes Bethel and Peer-Timo Bremer and Eric Brugger and Joseph Cottam and Matthieu Dorier and Soumya Dutta and Jean Favre and Thomas Fogal and Steffen Frey and Christoph Garth and Berk Geveci and William Godoy and Charles Hansen and Cyrus Harrison and Bernd Hentschel and Joseph Insley and Chris Johnson and Scott Klasky and Aaron Knoll and James Kress and Matthew Larsen and Jay Lofstead and Kwan-Liu Ma and Preeti Malakar and Jeremy Meredith and Kenneth Moreland and Paul Navrátil and Patrick O’Leary and Manish Parashar and Valerio Pascucci and John Patchett and Tom Peterka and Steve Petruzza and Norbert Podhorszki and David Pugmire and Michel Rasquin and Silvio Rizzi and David Rogers and Sudhanshu Sane and Franz Sauer and Robert Sisneros and Han-Wei Shen and Will Usher and Rhonda Vickery and Venkatram Vishwanath and Ingo Wald and Ruonan Wang and Gunther Weber and Brad Whitlock and Matthew Wolf and Hongfeng Yu and Sean Ziegeler},
url = {https://dsscale.org/wp-content/uploads/2020/10/ISTP.pdf},
doi = {10.1177/1094342020935991},
year = {2020},
date = {2020-08-14},
journal = {The International Journal of High Performance Computing Applications},
volume = {34},
number = {6},
pages = {676-691},
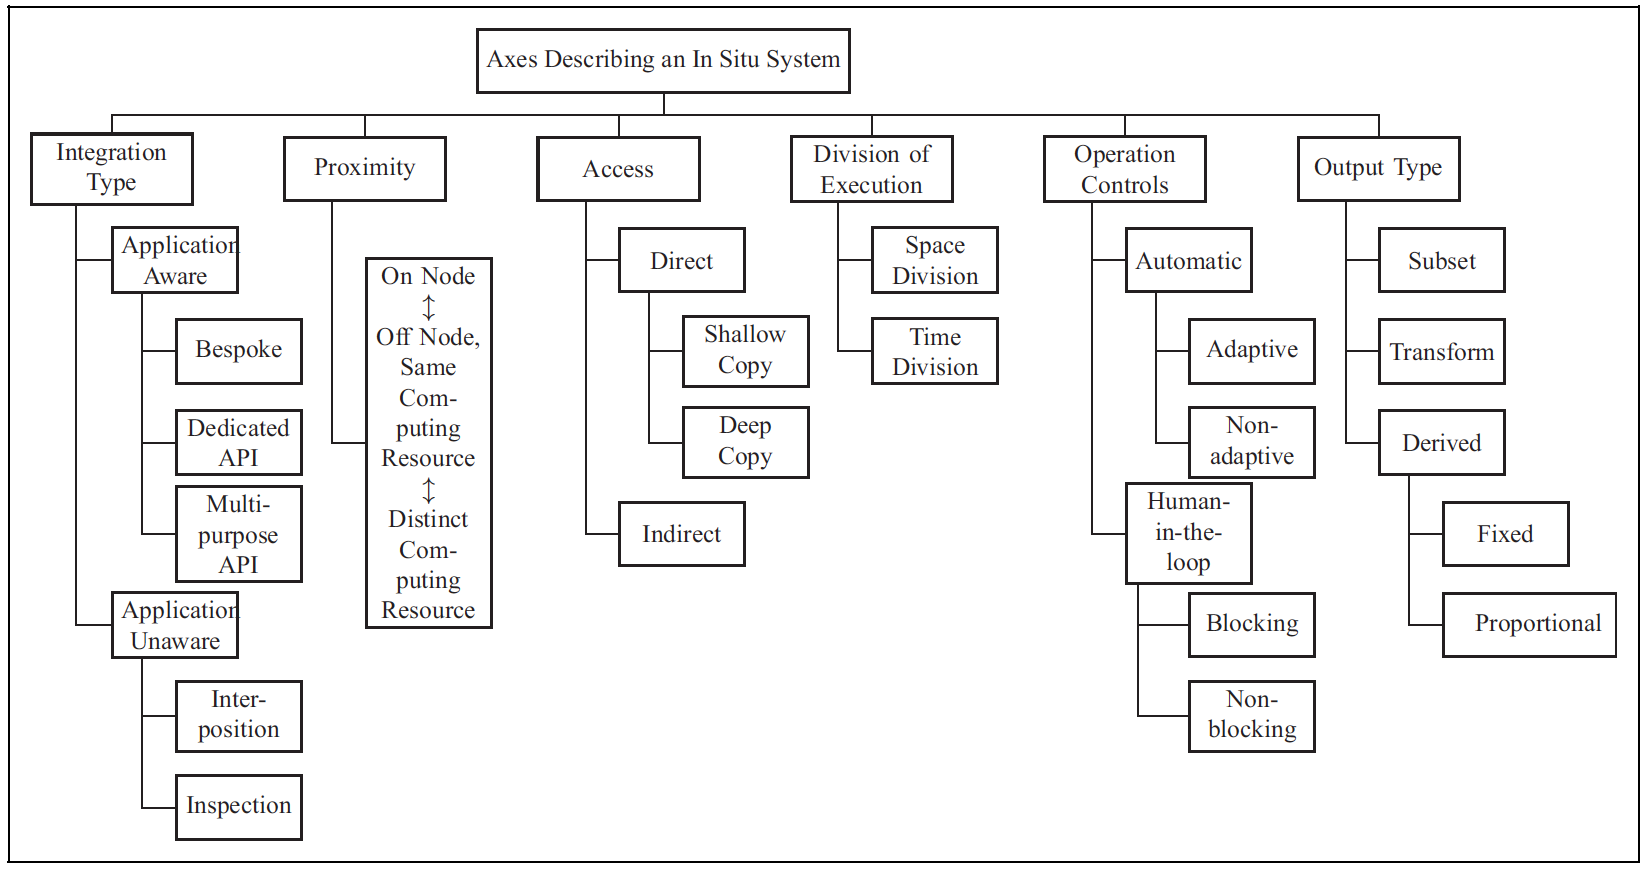
abstract = {The term “in situ processing” has evolved over the last decade to mean both a specific strategy for visualizing and analyzing data and an umbrella term for a processing paradigm. The resulting confusion makes it difficult for visualization and analysis scientists to communicate with each other and with their stakeholders. To address this problem, a group of over 50 experts convened with the goal of standardizing terminology. This paper summarizes their findings and proposes a new terminology for describing in situ systems. An important finding from this group was that in situ systems are best described via multiple, distinct axes: integration type, proximity, access, division of execution, operation controls, and output type. This paper discusses these axes, evaluates existing systems within the axes, and explores how currently used terms relate to the axes.},
keywords = {in situ processing, scientific visualization},
pubstate = {published},
tppubtype = {article}
}
2019
Dutta, Soumya; Brady, Riley; Maltrud, Mathew; Wolfram, Philip; Bujack, Roxana
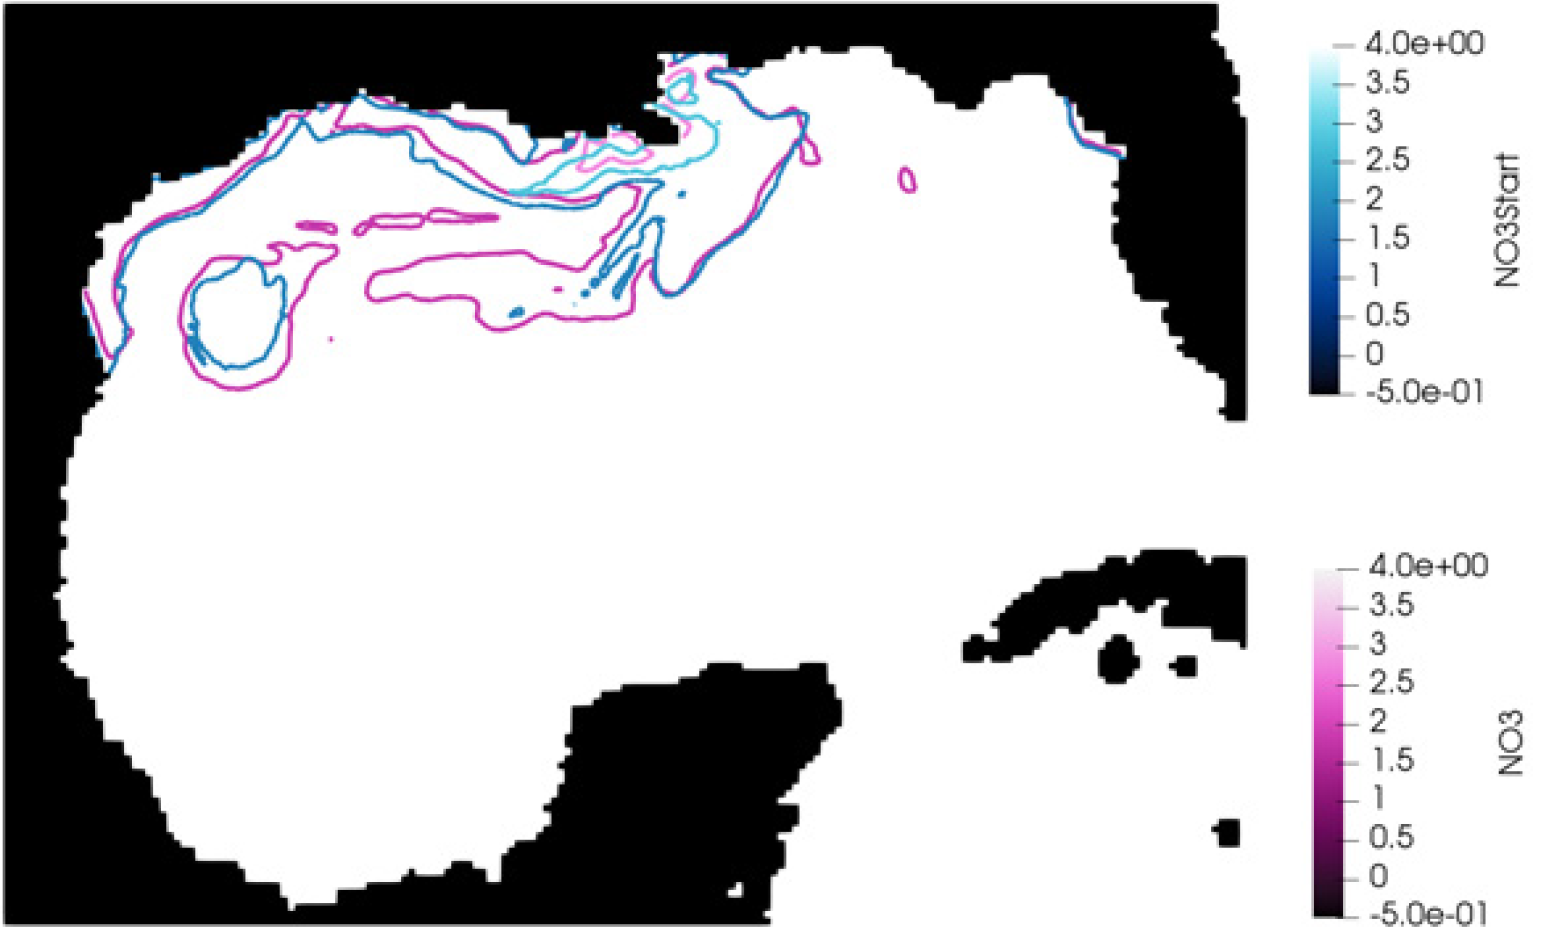
Leveraging Lagrangian Analysis for Discriminating Nutrient Origins Proceedings Article
In: Bujack, Roxana; Feige, Kathrin; Rink, Karsten; Zeckzer, Dirk (Ed.): Workshop on Visualisation in Environmental Sciences (EnvirVis), pp. 17-24, The Eurographics Association, 2019, ISBN: 978-3-03868-086-4, (LA-UR-19-22455).
Links | BibTeX | Tags: human-centered computing, scientific visualization
@inproceedings{N20103:2019,

title = {Leveraging Lagrangian Analysis for Discriminating Nutrient Origins},

author = {Soumya Dutta and Riley Brady and Mathew Maltrud and Philip Wolfram and Roxana Bujack},

editor = {Roxana Bujack and Kathrin Feige and Karsten Rink and Dirk Zeckzer},

url = {https://dsscale.org/wp-content/uploads/2019/07/leveraging-lagrangian-analysis-for-discriminating-nutrient-origins.pdf},

doi = {10.2312/envirvis.20191100},

isbn = {978-3-03868-086-4},

year  = {2019},

date = {2019-01-01},

booktitle = {Workshop on Visualisation in Environmental Sciences (EnvirVis)},

pages = {17-24},

publisher = {The Eurographics Association},

note = {LA-UR-19-22455},

keywords = {human-centered computing, scientific visualization},

pubstate = {published},

tppubtype = {inproceedings}

}
2018
Biswas, Ayan; Dutta, Soumya; Pulido, Jesus; Ahrens, James
In Situ Data-driven Adaptive Sampling for Large-scale Simulation Data Summarization Proceedings Article
In: Proceedings of the Workshop on In Situ Infrastructures for Enabling Extreme-Scale Analysis and Visualization, pp. 13–18, ACM, Dallas, Texas, 2018, ISBN: 978-1-4503-6579-6.
Abstract | Links | BibTeX | Tags: human-centered computing, Mathematics and Computing, scientific visualization, statistical paradigms
@inproceedings{Biswas:2018:SDA:3281464.3281467,
title = {In Situ Data-driven Adaptive Sampling for Large-scale Simulation Data Summarization},
author = {Ayan Biswas and Soumya Dutta and Jesus Pulido and James Ahrens},
url = {http://doi.acm.org/10.1145/3281464.3281467
https://datascience.dsscale.org/wp-content/uploads/2019/01/LA-UR-18-28035.pdf},
doi = {10.1145/3281464.3281467},
isbn = {978-1-4503-6579-6},
year = {2018},
date = {2018-01-01},
booktitle = {Proceedings of the Workshop on In Situ Infrastructures for Enabling Extreme-Scale Analysis and Visualization},
pages = {13--18},
publisher = {ACM},
address = {Dallas, Texas},
series = {ISAV '18},
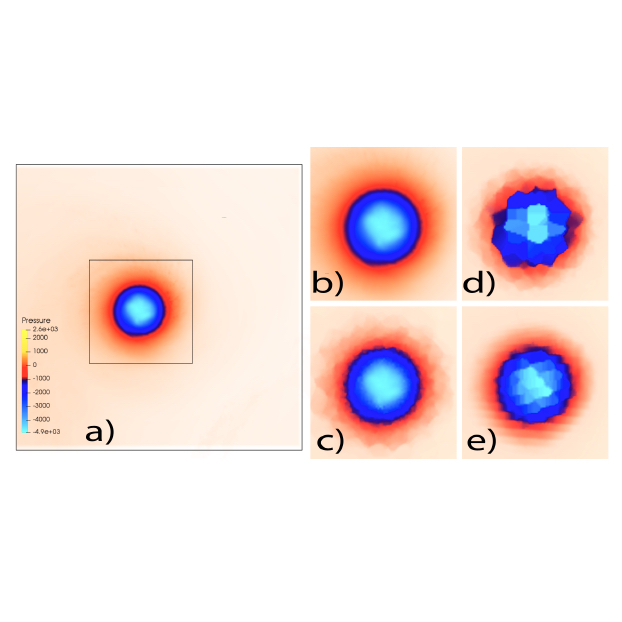
abstract = {Recent advancements in high-performance computing have enabled scientists to model various scientific phenomena in great detail. However, the analysis and visualization of the output data from such large-scale simulations are posing significant challenges due to their excessive size and disk I/O bottlenecks. One viable solution to this problem is to create a sub-sampled dataset which is able to preserve the important information of the data and also is significantly smaller in size compared to the raw data. Creating an in situ workflow for generating such intelligently sub-sampled datasets is of prime importance for such simulations. In this work, we propose an information-driven data sampling technique and compare it with two well-known sampling methods to demonstrate the superiority of the proposed method. The in situ performance of the proposed method is evaluated by applying it to the Nyx Cosmology simulation. We compare and contrast the performance of these various sampling algorithms and provide a holistic view of all the methods so that the scientists can choose appropriate sampling schemes based on their analysis requirements.},
keywords = {human-centered computing, Mathematics and Computing, scientific visualization, statistical paradigms},
pubstate = {published},
tppubtype = {inproceedings}
}
2017
Samsel, Francesca; Patchett, John; Rogers, David; Tsai, Karen
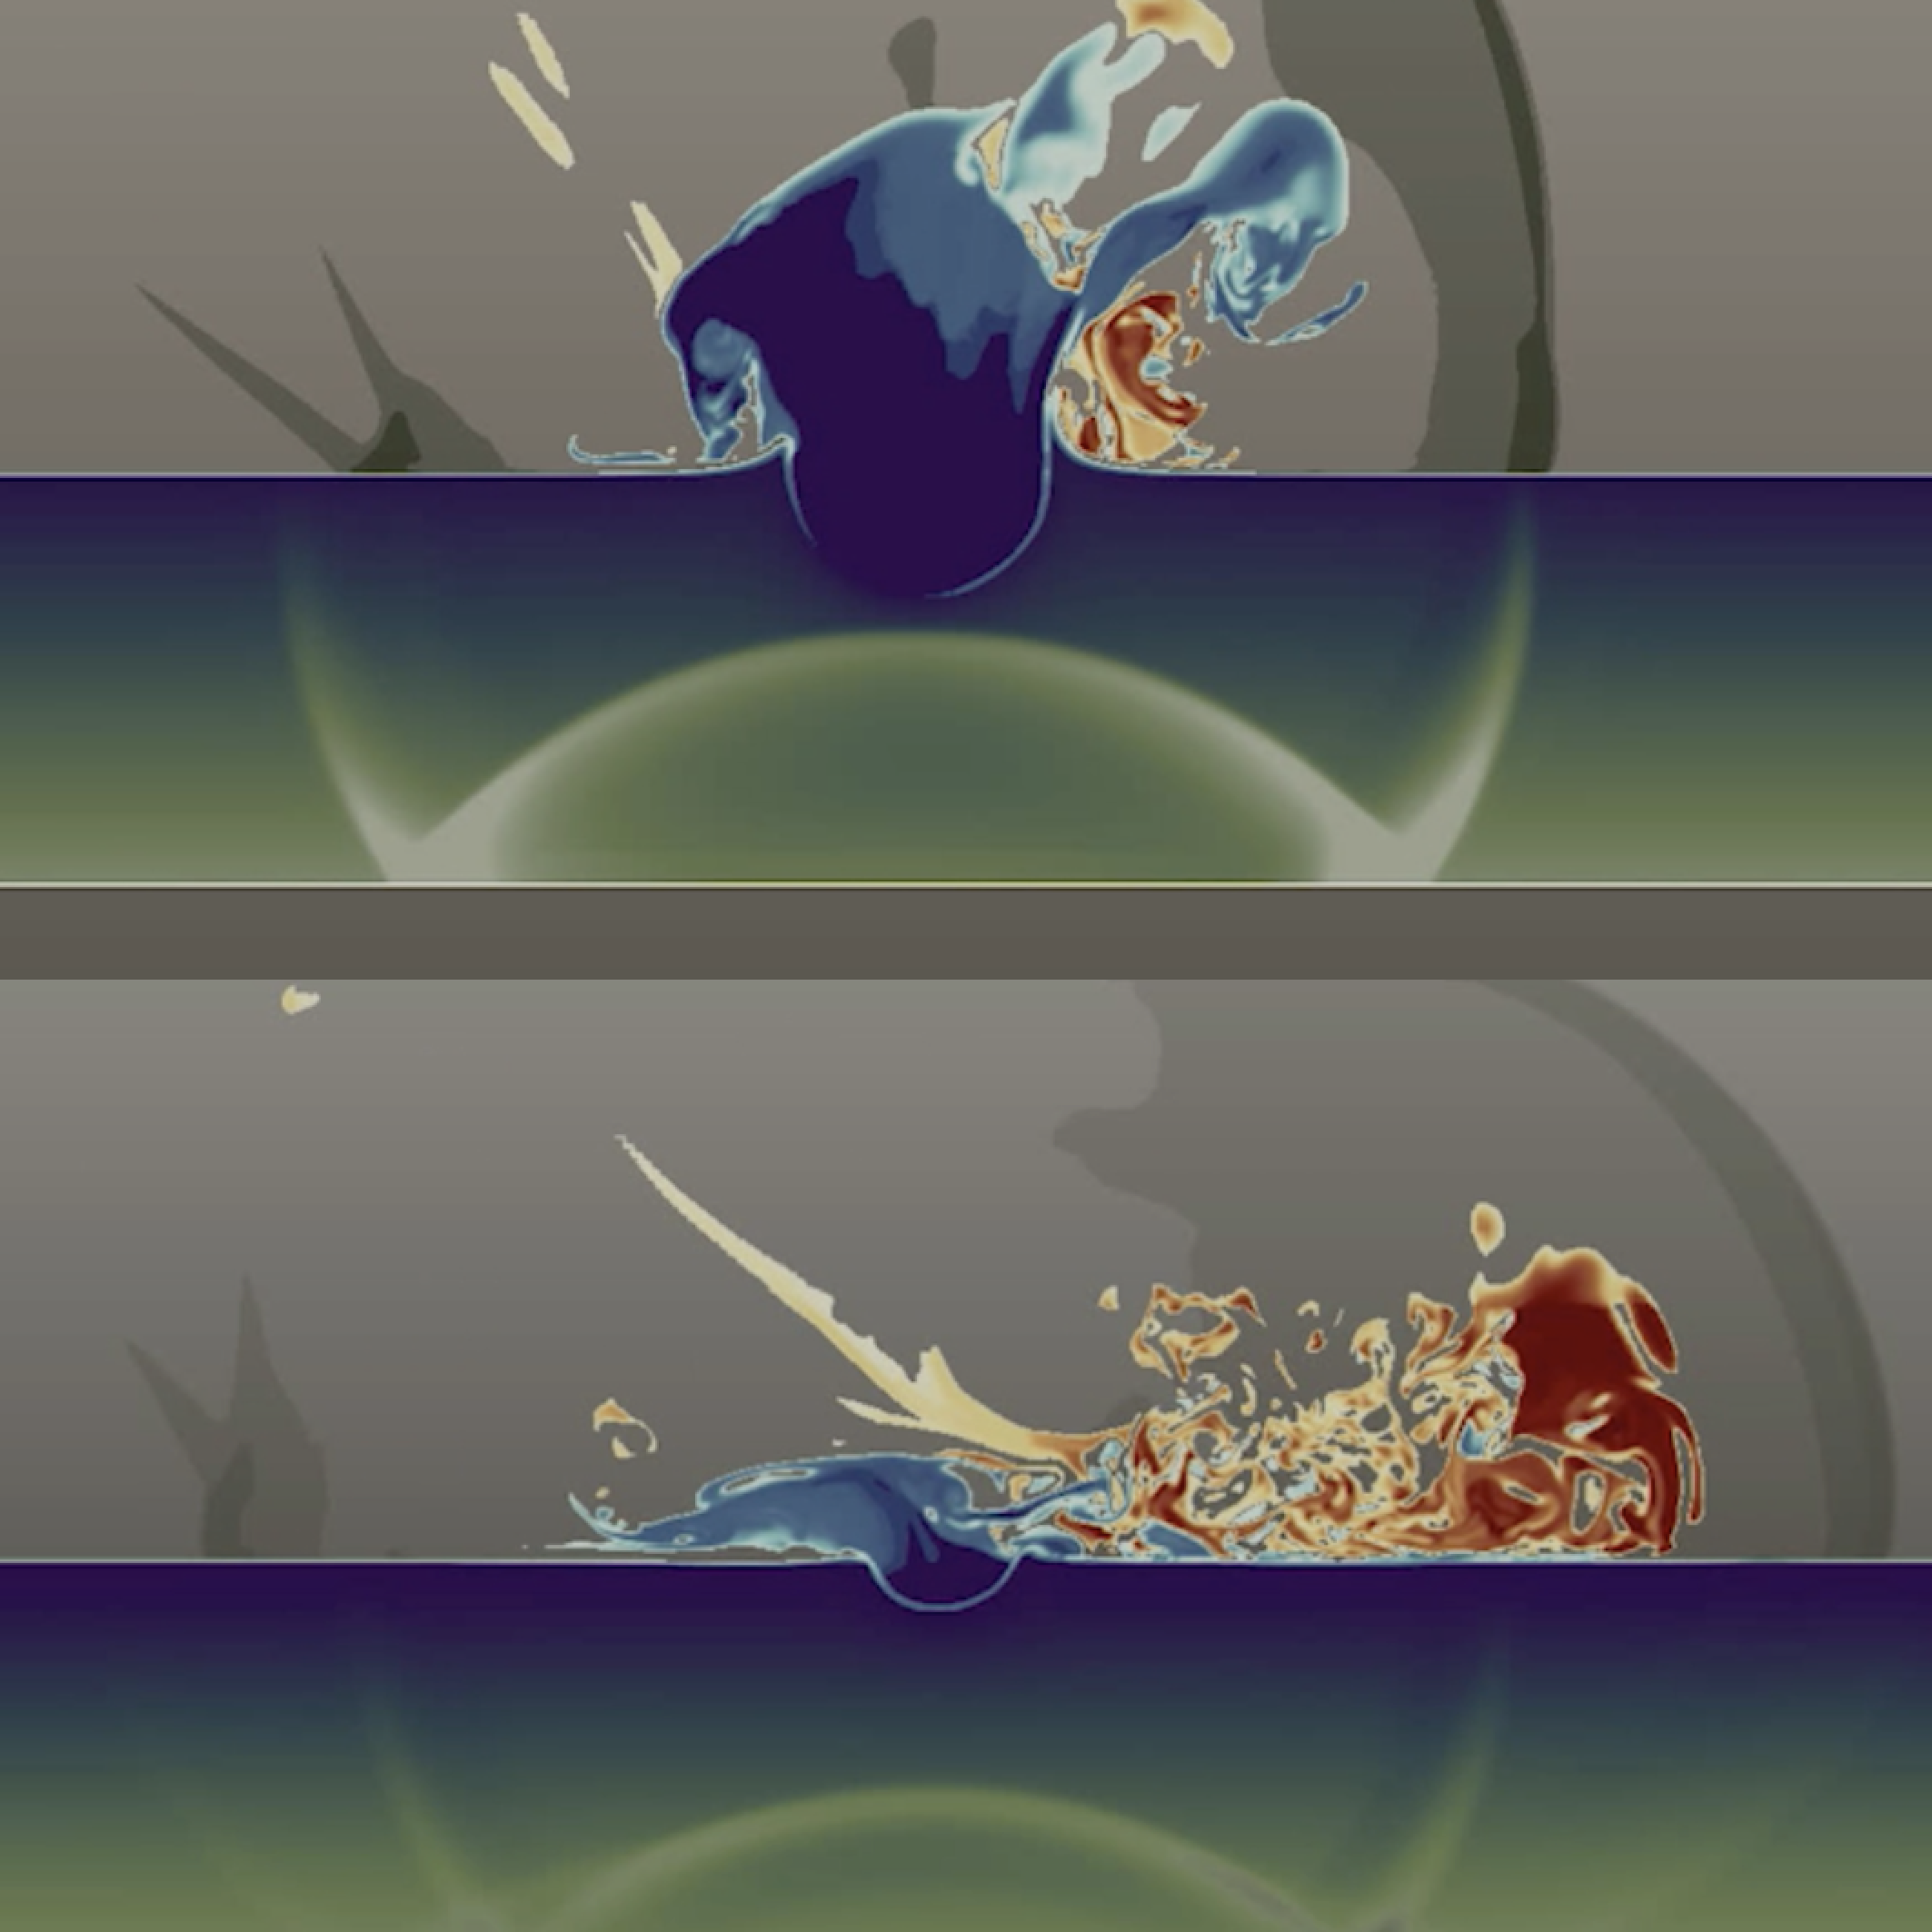
Employing Color Theory to Visualize Volume-rendered Multivariate Ensembles of Asteroid Impact Simulations Proceedings Article
In: Proceedings of the 2017 CHI Conference Extended Abstracts on Human Factors in Computing Systems, pp. 1126-1134, ACM, 2017, ISBN: 978-1-4503-4656-6, (LA-UR-17-20419).
Abstract | Links | BibTeX | Tags: colormaps, ensemble visualization, scientific visualization, visualization design, volume rendering
@inproceedings{LAPR-2017-027464,

title = {Employing Color Theory to Visualize Volume-rendered Multivariate Ensembles of Asteroid Impact Simulations},

author = {Francesca Samsel and John Patchett and David Rogers and Karen Tsai},

url = {http://doi.acm.org/10.1145/3027063.3053337},

doi = {10.1145/3027063.3053337},

isbn = {978-1-4503-4656-6},

year  = {2017},

date = {2017-05-06},

booktitle = {Proceedings of the 2017 CHI Conference Extended Abstracts on Human Factors in Computing Systems},

pages = {1126-1134},

publisher = {ACM},

series = {CHI EA '17},

abstract = {We describe explorations and innovations developed to help scientists understand an ensemble of large scale simulations of asteroid impacts in the ocean. The simulations were run to help scientists determine the characteristics of asteroids that NASA should track, so that communities at risk from impact can be given advanced notice. Of relevance to the CHI community are 1) hands-on workflow issues specific to exploring ensembles of large scientific data, 2) innovations in exploring such data ensembles with color, and 3) examples of multidisciplinary collaboration.},

note = {LA-UR-17-20419},

keywords = {colormaps, ensemble visualization, scientific visualization, visualization design, volume rendering},

pubstate = {published},

tppubtype = {inproceedings}

}
2016
Samsel, Francesca; Klassen, Sebastian; Petersen, Mark; Turton, Terece; Abram, Greg; Rogers, David; Ahrens, James
Interactive Colormapping: Enabling Multiple Data Ranges, Detailed Views of Ocean Salinity Proceedings Article
In: Proceedings of the 34rd Annual ACM Conference Extended Abstracts on Human Factors in Computing Systems, ACM, San Jose, California, 2016, (LA-UR-15-20105).
Abstract | Links | BibTeX | Tags: climate science, color perception, color theory, colormaps, high-resolution datasets, scientific visualization
@inproceedings{Samsel:2016:CIP:2702613.2702975,
title = {Interactive Colormapping: Enabling Multiple Data Ranges, Detailed Views of Ocean Salinity},
author = {Francesca Samsel and Sebastian Klassen and Mark Petersen and Terece Turton and Greg Abram and David Rogers and James Ahrens},
url = {http://datascience.dsscale.org/wp-content/uploads/2016/06/InteractiveColormapping.pdf},
year = {2016},
date = {2016-01-01},
booktitle = {Proceedings of the 34rd Annual ACM Conference Extended Abstracts on Human Factors in Computing Systems},
publisher = {ACM},
address = {San Jose, California},
series = {CHI EA '16},
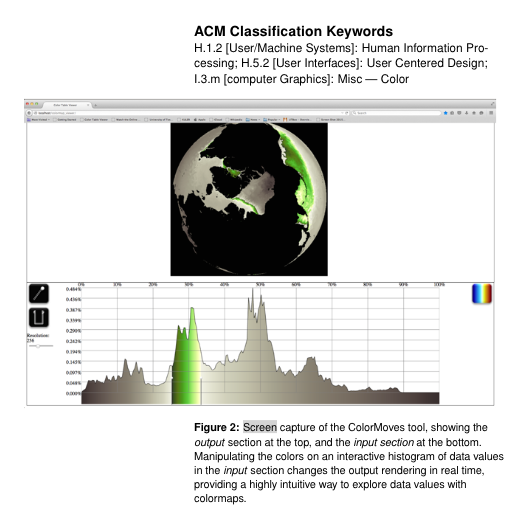
abstract = {Ocean salinity is a critical component to understanding climate change. Salinity concentrations and temperature drive large ocean currents which in turn drive global weather patterns. Melting ice caps lower salinity at the poles while river deltas bring fresh water into the ocean worldwide. These processes slow ocean currents, changing weather patterns and producing extreme climate events which disproportionally affect those living in poverty. Analysis of salinity presents a unique visualization challenge. Important data are found in narrow data ranges, varying with global location. Changing values of salinity are important in understanding ocean currents, but are difficult to map to colors using traditional tools. Commonly used colormaps may not provide sufficient detail for this data. Current editing tools do not easily enable a scientist to explore the subtleties of salinity. We present a workflow, enabled by an interactive colormap tool that allows a scientist to interactively apply sophisticated colormaps to scalar data. The intuitive and immediate interaction of the scientist with the data is a critical contribution of this work.},
note = {LA-UR-15-20105},
keywords = {climate science, color perception, color theory, colormaps, high-resolution datasets, scientific visualization},
pubstate = {published},
tppubtype = {inproceedings}
}
2015
Ahrens, James
Implications of Numerical and Data Intensive Technology Trends on Scientific Visualization and Analysis Presentation
18.03.2015, (LA-UR-pending).
Abstract | Links | BibTeX | Tags: scientific visualization
@misc{Ahrens2015b,

title = {Implications of Numerical and Data Intensive Technology Trends on Scientific Visualization and Analysis},

author = {James Ahrens},

url = {http://datascience.dsscale.org/wp-content/uploads/2016/08/Implications_of_Numerical_and_Data_Intensive_Technology_Trends_on_Scientific_Visualization_and_Analysis.pdf

https://www.pathlms.com/siam/courses/1043/sections/1261/thumbnail_video_presentations/9886

http://www.siam.org/meetings/cse15/cse15_program.pdf},

year  = {2015},

date = {2015-03-18},

abstract = {Technology trends in numerically and data intensive computing have the potential to reshape and significantly advance how we visualize and analyze the results of scientific simulations. However, next generation numerically intensive supercomputers are bound by power and storage constraints. These require us to transition from standard post-processing visualization and analysis approaches to intelligent, automated in-situ ones. In addition, data intensive technology trends that support accessing and understanding our data using intuitive, web-based and query-driven interfaces are now the norm. In this talk, I will discuss these trends and several freely available, open-source approaches that leverage them.},

note = {LA-UR-pending},

keywords = {scientific visualization},

pubstate = {published},

tppubtype = {presentation}

}
Samsel, Francesca; Petersen, Mark; Geld, Terece; Abram, Greg; Wendelberger, Joanne; Ahrens, James
Colormaps That Improve Perception of High-Resolution Ocean Data Proceedings Article
In: Proceedings of the 33rd Annual ACM Conference Extended Abstracts on Human Factors in Computing Systems, pp. 703–710, ACM, Seoul, Republic of Korea, 2015, ISBN: 978-1-4503-3146-3, (LA-UR-15-20105).
Abstract | Links | BibTeX | Tags: climate science, color perception, color theory, colormaps, high-resolution datasets, scientific visualization
@inproceedings{Samsel:2015:CIP:2702613.2702975,
title = {Colormaps That Improve Perception of High-Resolution Ocean Data},
author = {Francesca Samsel and Mark Petersen and Terece Geld and Greg Abram and Joanne Wendelberger and James Ahrens},
url = {http://datascience.dsscale.org/wp-content/uploads/2016/06/ColormapsThatImprovePerceptionOfHigh-ResolutionOceanData.pdf},
doi = {10.1145/2702613.2702975},
isbn = {978-1-4503-3146-3},
year = {2015},
date = {2015-01-01},
booktitle = {Proceedings of the 33rd Annual ACM Conference Extended Abstracts on Human Factors in Computing Systems},
pages = {703--710},
publisher = {ACM},
address = {Seoul, Republic of Korea},
series = {CHI EA '15},
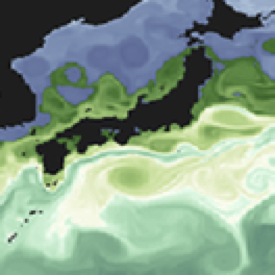
abstract = {Scientists from the Climate, Ocean and Sea Ice Modeling Team (COSIM) at the Los Alamos National Laboratory (LANL) are interested in gaining a deeper understanding of three primary ocean currents: the Gulf Stream, the Kuroshio Current, and the Agulhas Current & Retroflection. To address these needs, visual artist Francesca Samsel teamed up with experts from the areas of computer science, climate science, statistics, and perceptual science. By engaging an artist specializing in color, we created colormaps that provide the ability to see greater detail in these high-resolution datasets. The new colormaps applied to the POP dataset enabled scientists to see areas of interest unclear using standard colormaps. Improvements in the perceptual range of color allowed scientists to highlight structures within specific ocean currents. Work with the COSIM team members drove development of nested colormaps which provide further detail to the scientists.},
note = {LA-UR-15-20105},
keywords = {climate science, color perception, color theory, colormaps, high-resolution datasets, scientific visualization},
pubstate = {published},
tppubtype = {inproceedings}
}
2011
Mitchell, Christopher; Ahrens, James; Wang, Jun
Visio: Enabling interactive visualization of ultra-scale, time series data via high-bandwidth distributed i/o systems Proceedings Article
In: Parallel & Distributed Processing Symposium (IPDPS), 2011 IEEE International, pp. 68–79, IEEE 2011, (LA-UR-10-07014).
Abstract | Links | BibTeX | Tags: distributed i/o, Parallel Computing, scientific visualization, ultra-scale, visualization
@inproceedings{mitchell2011visio,
title = {Visio: Enabling interactive visualization of ultra-scale, time series data via high-bandwidth distributed i/o systems},
author = {Christopher Mitchell and James Ahrens and Jun Wang},
url = {http://datascience.dsscale.org/wp-content/uploads/2016/06/VisIO-IPDPS11.pdf},
year = {2011},
date = {2011-01-01},
booktitle = {Parallel & Distributed Processing Symposium (IPDPS), 2011 IEEE International},
pages = {68--79},
organization = {IEEE},
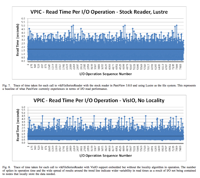
abstract = {Petascale simulations compute at resolutions ranging into billions of cells and write terabytes of data for visualization and analysis. Interactive visualization of this time series is a desired step before starting a new run. The I/O subsystem and associated network often are a significant impediment to interactive visualization of time-varying data; as they are not configured or provisioned to provide necessary I/O read rates. In this paper, we propose a new I/O library for visualization applications: VisIO. Visualization applications commonly use N- to-N reads within their parallel enabled readers which provides an incentive for a shared-nothing approach to I/O, similar to other data-intensive approaches such as Hadoop. However, unlike other data-intensive applications, visualization requires: (1) interactive performance for large data volumes, (2) compatibility with MPI and POSIX file system semantics for compatibility with existing infrastructure, and (3) use of existing file formats and their stipulated data partitioning rules. VisIO, provides a mechanism for using a non-POSIX distributed file system to provide linear scaling of I/O bandwidth. In addition, we introduce a novel scheduling algorithm that helps to co-locate visualization processes on nodes with the requested data. Testing using VisIO integrated into ParaView was conducted using the Hadoop Distributed File System (HDFS) on TACC’s Longhorn cluster. A representative dataset, VPIC, across 128 nodes showed a 64.4% read performance improvement compared to the provided Lustre installation. Also tested, was a dataset representing a global ocean salinity simulation that showed a 51.4% improvement in read performance over Lustre when using our VisIO system. VisIO, provides powerful high-performance I/O services to visualization applications, allowing for interactive performance with ultra-scale, time-series data.},
note = {LA-UR-10-07014},
keywords = {distributed i/o, Parallel Computing, scientific visualization, ultra-scale, visualization},
pubstate = {published},
tppubtype = {inproceedings}
}
2009
Santos, Emanuele; Lins, Lauro; Ahrens, James; Freire, Juliana; Silva, Claudio T
Vismashup: Streamlining the creation of custom visualization applications Journal Article
In: Visualization and Computer Graphics, IEEE Transactions on, vol. 15, no. 6, pp. 1539–1546, 2009, (LA-UR-10-02240).
Abstract | Links | BibTeX | Tags: Dataflow, scientific visualization, Visualization Systems
@article{santos2009vismashup,

title = {Vismashup: Streamlining the creation of custom visualization applications},

author = {Emanuele Santos and Lauro Lins and James Ahrens and Juliana Freire and Claudio T Silva},

url = {http://datascience.dsscale.org/wp-content/uploads/2016/06/VISMASHUPStreamliningTheCreationOfCustomVisualizationApplications.pdf},

year  = {2009},

date = {2009-01-01},

journal = {Visualization and Computer Graphics, IEEE Transactions on},

volume = {15},

number = {6},

pages = {1539--1546},

publisher = {IEEE},

abstract = {Visualization is essential for understanding the increasing volumes of digital data. However, the process required to create insightful visualizations is involved and time consuming. Although several visualization tools are available, including tools with sophisticated visual interfaces, they are out of reach for users who have little or no knowledge of visualization techniques and/or who do not have programming expertise. In this paper, we propose VISMASHUP, a new framework for streamlining the creation of customized visualization applications. Because these applications can be customized for very specific tasks, they can hide much of the complexity in a visualization specification and make it easier for users to explore visualizations by manipulating a small set of parameters. We describe the framework and how it supports the various tasks a designer needs to carry out to develop an application, from mining and exploring a set of visualization specifications (pipelines), to the creation of simplified views of the pipelines, and the automatic generation of the application and its interface. We also describe the implementation of the system and demonstrate its use in two real application scenarios.},

note = {LA-UR-10-02240},

keywords = {Dataflow, scientific visualization, Visualization Systems},

pubstate = {published},

tppubtype = {article}

}
Childs, Hank; Ahern, Sean; Ahrens, James; Bauer, Andrew; Bennett, Janine; Bethel, Wes; Bremer, Peer-Timo; Brugger, Eric; Cottam, Joseph; Dorier, Matthieu; Dutta, Soumya; Favre, Jean; Fogal, Thomas; Frey, Steffen; Garth, Christoph; Geveci, Berk; Godoy, William; Hansen, Charles; Harrison, Cyrus; Hentschel, Bernd; Insley, Joseph; Johnson, Chris; Klasky, Scott; Knoll, Aaron; Kress, James; Larsen, Matthew; Lofstead, Jay; Ma, Kwan-Liu; Malakar, Preeti; Meredith, Jeremy; Moreland, Kenneth; Navrátil, Paul; O’Leary, Patrick; Parashar, Manish; Pascucci, Valerio; Patchett, John; Peterka, Tom; Petruzza, Steve; Podhorszki, Norbert; Pugmire, David; Rasquin, Michel; Rizzi, Silvio; Rogers, David; Sane, Sudhanshu; Sauer, Franz; Sisneros, Robert; Shen, Han-Wei; Usher, Will; Vickery, Rhonda; Vishwanath, Venkatram; Wald, Ingo; Wang, Ruonan; Weber, Gunther; Whitlock, Brad; Wolf, Matthew; Yu, Hongfeng; Ziegeler, Sean
A terminology for in situ visualization and analysis systems Journal Article
In: The International Journal of High Performance Computing Applications, vol. 34, no. 6, pp. 676-691, 2020.
@article{doi:10.1177/1094342020935991,

title = {A terminology for in situ visualization and analysis systems},

author = {Hank Childs and Sean Ahern and James Ahrens and Andrew Bauer and Janine Bennett and Wes Bethel and Peer-Timo Bremer and Eric Brugger and Joseph Cottam and Matthieu Dorier and Soumya Dutta and Jean Favre and Thomas Fogal and Steffen Frey and Christoph Garth and Berk Geveci and William Godoy and Charles Hansen and Cyrus Harrison and Bernd Hentschel and Joseph Insley and Chris Johnson and Scott Klasky and Aaron Knoll and James Kress and Matthew Larsen and Jay Lofstead and Kwan-Liu Ma and Preeti Malakar and Jeremy Meredith and Kenneth Moreland and Paul Navrátil and Patrick O’Leary and Manish Parashar and Valerio Pascucci and John Patchett and Tom Peterka and Steve Petruzza and Norbert Podhorszki and David Pugmire and Michel Rasquin and Silvio Rizzi and David Rogers and Sudhanshu Sane and Franz Sauer and Robert Sisneros and Han-Wei Shen and Will Usher and Rhonda Vickery and Venkatram Vishwanath and Ingo Wald and Ruonan Wang and Gunther Weber and Brad Whitlock and Matthew Wolf and Hongfeng Yu and Sean Ziegeler},

url = {https://dsscale.org/wp-content/uploads/2020/10/ISTP.pdf},

doi = {10.1177/1094342020935991},

year  = {2020},

date = {2020-08-14},

journal = {The International Journal of High Performance Computing Applications},

volume = {34},

number = {6},

pages = {676-691},

abstract = {The term “in situ processing” has evolved over the last decade to mean both a specific strategy for visualizing and analyzing data and an umbrella term for a processing paradigm. The resulting confusion makes it difficult for visualization and analysis scientists to communicate with each other and with their stakeholders. To address this problem, a group of over 50 experts convened with the goal of standardizing terminology. This paper summarizes their findings and proposes a new terminology for describing in situ systems. An important finding from this group was that in situ systems are best described via multiple, distinct axes: integration type, proximity, access, division of execution, operation controls, and output type. This paper discusses these axes, evaluates existing systems within the axes, and explores how currently used terms relate to the axes.},

keywords = {},

pubstate = {published},

tppubtype = {article}

}
Dutta, Soumya; Brady, Riley; Maltrud, Mathew; Wolfram, Philip; Bujack, Roxana
Leveraging Lagrangian Analysis for Discriminating Nutrient Origins Proceedings Article
In: Bujack, Roxana; Feige, Kathrin; Rink, Karsten; Zeckzer, Dirk (Ed.): Workshop on Visualisation in Environmental Sciences (EnvirVis), pp. 17-24, The Eurographics Association, 2019, ISBN: 978-3-03868-086-4, (LA-UR-19-22455).
@inproceedings{N20103:2019,

title = {Leveraging Lagrangian Analysis for Discriminating Nutrient Origins},

author = {Soumya Dutta and Riley Brady and Mathew Maltrud and Philip Wolfram and Roxana Bujack},

editor = {Roxana Bujack and Kathrin Feige and Karsten Rink and Dirk Zeckzer},

url = {https://dsscale.org/wp-content/uploads/2019/07/leveraging-lagrangian-analysis-for-discriminating-nutrient-origins.pdf},

doi = {10.2312/envirvis.20191100},

isbn = {978-3-03868-086-4},

year  = {2019},

date = {2019-01-01},

booktitle = {Workshop on Visualisation in Environmental Sciences (EnvirVis)},

pages = {17-24},

publisher = {The Eurographics Association},

note = {LA-UR-19-22455},

keywords = {},

pubstate = {published},

tppubtype = {inproceedings}

}
Biswas, Ayan; Dutta, Soumya; Pulido, Jesus; Ahrens, James
In Situ Data-driven Adaptive Sampling for Large-scale Simulation Data Summarization Proceedings Article
In: Proceedings of the Workshop on In Situ Infrastructures for Enabling Extreme-Scale Analysis and Visualization, pp. 13–18, ACM, Dallas, Texas, 2018, ISBN: 978-1-4503-6579-6.
@inproceedings{Biswas:2018:SDA:3281464.3281467,

title = {In Situ Data-driven Adaptive Sampling for Large-scale Simulation Data Summarization},

author = {Ayan Biswas and Soumya Dutta and Jesus Pulido and James Ahrens},

url = {http://doi.acm.org/10.1145/3281464.3281467

https://datascience.dsscale.org/wp-content/uploads/2019/01/LA-UR-18-28035.pdf},

doi = {10.1145/3281464.3281467},

isbn = {978-1-4503-6579-6},

year  = {2018},

date = {2018-01-01},

booktitle = {Proceedings of the Workshop on In Situ Infrastructures for Enabling Extreme-Scale Analysis and Visualization},

pages = {13--18},

publisher = {ACM},

address = {Dallas, Texas},

series = {ISAV '18},

abstract = {Recent advancements in high-performance computing have enabled scientists to model various scientific phenomena in great detail. However, the analysis and visualization of the output data from such large-scale simulations are posing significant challenges due to their excessive size and disk I/O bottlenecks. One viable solution to this problem is to create a sub-sampled dataset which is able to preserve the important information of the data and also is significantly smaller in size compared to the raw data. Creating an in situ workflow for generating such intelligently sub-sampled datasets is of prime importance for such simulations. In this work, we propose an information-driven data sampling technique and compare it with two well-known sampling methods to demonstrate the superiority of the proposed method. The in situ performance of the proposed method is evaluated by applying it to the Nyx Cosmology simulation. We compare and contrast the performance of these various sampling algorithms and provide a holistic view of all the methods so that the scientists can choose appropriate sampling schemes based on their analysis requirements.},

keywords = {},

pubstate = {published},

tppubtype = {inproceedings}

}
Samsel, Francesca; Patchett, John; Rogers, David; Tsai, Karen
Employing Color Theory to Visualize Volume-rendered Multivariate Ensembles of Asteroid Impact Simulations Proceedings Article
In: Proceedings of the 2017 CHI Conference Extended Abstracts on Human Factors in Computing Systems, pp. 1126-1134, ACM, 2017, ISBN: 978-1-4503-4656-6, (LA-UR-17-20419).
@inproceedings{LAPR-2017-027464,

title = {Employing Color Theory to Visualize Volume-rendered Multivariate Ensembles of Asteroid Impact Simulations},

author = {Francesca Samsel and John Patchett and David Rogers and Karen Tsai},

url = {http://doi.acm.org/10.1145/3027063.3053337},

doi = {10.1145/3027063.3053337},

isbn = {978-1-4503-4656-6},

year  = {2017},

date = {2017-05-06},

booktitle = {Proceedings of the 2017 CHI Conference Extended Abstracts on Human Factors in Computing Systems},

pages = {1126-1134},

publisher = {ACM},

series = {CHI EA '17},

abstract = {We describe explorations and innovations developed to help scientists understand an ensemble of large scale simulations of asteroid impacts in the ocean. The simulations were run to help scientists determine the characteristics of asteroids that NASA should track, so that communities at risk from impact can be given advanced notice. Of relevance to the CHI community are 1) hands-on workflow issues specific to exploring ensembles of large scientific data, 2) innovations in exploring such data ensembles with color, and 3) examples of multidisciplinary collaboration.},

note = {LA-UR-17-20419},

keywords = {},

pubstate = {published},

tppubtype = {inproceedings}

}
Samsel, Francesca; Klassen, Sebastian; Petersen, Mark; Turton, Terece; Abram, Greg; Rogers, David; Ahrens, James
Interactive Colormapping: Enabling Multiple Data Ranges, Detailed Views of Ocean Salinity Proceedings Article
In: Proceedings of the 34rd Annual ACM Conference Extended Abstracts on Human Factors in Computing Systems, ACM, San Jose, California, 2016, (LA-UR-15-20105).
@inproceedings{Samsel:2016:CIP:2702613.2702975,

title = {Interactive Colormapping: Enabling Multiple Data Ranges, Detailed Views of Ocean Salinity},

author = {Francesca Samsel and Sebastian Klassen and Mark Petersen and Terece Turton and Greg Abram and David Rogers and James Ahrens},

url = {http://datascience.dsscale.org/wp-content/uploads/2016/06/InteractiveColormapping.pdf},

year  = {2016},

date = {2016-01-01},

booktitle = {Proceedings of the 34rd Annual ACM Conference Extended Abstracts on Human Factors in Computing Systems},

publisher = {ACM},

address = {San Jose, California},

series = {CHI EA '16},

abstract = {Ocean salinity is a critical component to understanding climate change. Salinity concentrations and temperature drive large ocean currents which in turn drive global weather patterns. Melting ice caps lower salinity at the poles while river deltas bring fresh water into the ocean worldwide. These processes slow ocean currents, changing weather patterns and producing extreme climate events which disproportionally affect those living in poverty. Analysis of salinity presents a unique visualization challenge. Important data are found in narrow data ranges, varying with global location. Changing values of salinity are important in understanding ocean currents, but are difficult to map to colors using traditional tools. Commonly used colormaps may not provide sufficient detail for this data. Current editing tools do not easily enable a scientist to explore the subtleties of salinity. We present a workflow, enabled by an interactive colormap tool that allows a scientist to interactively apply sophisticated colormaps to scalar data. The intuitive and immediate interaction of the scientist with the data is a critical contribution of this work.},

note = {LA-UR-15-20105},

keywords = {},

pubstate = {published},

tppubtype = {inproceedings}

}
Ahrens, James
Implications of Numerical and Data Intensive Technology Trends on Scientific Visualization and Analysis Presentation
18.03.2015, (LA-UR-pending).
@misc{Ahrens2015b,

title = {Implications of Numerical and Data Intensive Technology Trends on Scientific Visualization and Analysis},

author = {James Ahrens},

url = {http://datascience.dsscale.org/wp-content/uploads/2016/08/Implications_of_Numerical_and_Data_Intensive_Technology_Trends_on_Scientific_Visualization_and_Analysis.pdf

https://www.pathlms.com/siam/courses/1043/sections/1261/thumbnail_video_presentations/9886

http://www.siam.org/meetings/cse15/cse15_program.pdf},

year  = {2015},

date = {2015-03-18},

abstract = {Technology trends in numerically and data intensive computing have the potential to reshape and significantly advance how we visualize and analyze the results of scientific simulations. However, next generation numerically intensive supercomputers are bound by power and storage constraints. These require us to transition from standard post-processing visualization and analysis approaches to intelligent, automated in-situ ones. In addition, data intensive technology trends that support accessing and understanding our data using intuitive, web-based and query-driven interfaces are now the norm. In this talk, I will discuss these trends and several freely available, open-source approaches that leverage them.},

note = {LA-UR-pending},

keywords = {},

pubstate = {published},

tppubtype = {presentation}

}
Samsel, Francesca; Petersen, Mark; Geld, Terece; Abram, Greg; Wendelberger, Joanne; Ahrens, James
Colormaps That Improve Perception of High-Resolution Ocean Data Proceedings Article
In: Proceedings of the 33rd Annual ACM Conference Extended Abstracts on Human Factors in Computing Systems, pp. 703–710, ACM, Seoul, Republic of Korea, 2015, ISBN: 978-1-4503-3146-3, (LA-UR-15-20105).
@inproceedings{Samsel:2015:CIP:2702613.2702975,

title = {Colormaps That Improve Perception of High-Resolution Ocean Data},

author = {Francesca Samsel and Mark Petersen and Terece Geld and Greg Abram and Joanne Wendelberger and James Ahrens},

url = {http://datascience.dsscale.org/wp-content/uploads/2016/06/ColormapsThatImprovePerceptionOfHigh-ResolutionOceanData.pdf},

doi = {10.1145/2702613.2702975},

isbn = {978-1-4503-3146-3},

year  = {2015},

date = {2015-01-01},

booktitle = {Proceedings of the 33rd Annual ACM Conference Extended Abstracts on Human Factors in Computing Systems},

pages = {703--710},

publisher = {ACM},

address = {Seoul, Republic of Korea},

series = {CHI EA '15},

abstract = {Scientists from the Climate, Ocean and Sea Ice Modeling Team (COSIM) at the Los Alamos National Laboratory (LANL) are interested in gaining a deeper understanding of three primary ocean currents: the Gulf Stream, the Kuroshio Current, and the Agulhas Current & Retroflection. To address these needs, visual artist Francesca Samsel teamed up with experts from the areas of computer science, climate science, statistics, and perceptual science. By engaging an artist specializing in color, we created colormaps that provide the ability to see greater detail in these high-resolution datasets. The new colormaps applied to the POP dataset enabled scientists to see areas of interest unclear using standard colormaps. Improvements in the perceptual range of color allowed scientists to highlight structures within specific ocean currents. Work with the COSIM team members drove development of nested colormaps which provide further detail to the scientists.},

note = {LA-UR-15-20105},

keywords = {},

pubstate = {published},

tppubtype = {inproceedings}

}
Mitchell, Christopher; Ahrens, James; Wang, Jun
Visio: Enabling interactive visualization of ultra-scale, time series data via high-bandwidth distributed i/o systems Proceedings Article
In: Parallel & Distributed Processing Symposium (IPDPS), 2011 IEEE International, pp. 68–79, IEEE 2011, (LA-UR-10-07014).
@inproceedings{mitchell2011visio,

title = {Visio: Enabling interactive visualization of ultra-scale, time series data via high-bandwidth distributed i/o systems},

author = {Christopher Mitchell and James Ahrens and Jun Wang},

url = {http://datascience.dsscale.org/wp-content/uploads/2016/06/VisIO-IPDPS11.pdf},

year  = {2011},

date = {2011-01-01},

booktitle = {Parallel & Distributed Processing Symposium (IPDPS), 2011 IEEE International},

pages = {68--79},

organization = {IEEE},

abstract = {Petascale simulations compute at resolutions ranging into billions of cells and write terabytes of data for visualization and analysis. Interactive visualization of this time series is a desired step before starting a new run. The I/O subsystem and associated network often are a significant impediment to interactive visualization of time-varying data; as they are not configured or provisioned to provide necessary I/O read rates. In this paper, we propose a new I/O library for visualization applications: VisIO. Visualization applications commonly use N- to-N reads within their parallel enabled readers which provides an incentive for a shared-nothing approach to I/O, similar to other data-intensive approaches such as Hadoop. However, unlike other data-intensive applications, visualization requires: (1) interactive performance for large data volumes, (2) compatibility with MPI and POSIX file system semantics for compatibility with existing infrastructure, and (3) use of existing file formats and their stipulated data partitioning rules. VisIO, provides a mechanism for using a non-POSIX distributed file system to provide linear scaling of I/O bandwidth. In addition, we introduce a novel scheduling algorithm that helps to co-locate visualization processes on nodes with the requested data. Testing using VisIO integrated into ParaView was conducted using the Hadoop Distributed File System (HDFS) on TACC’s Longhorn cluster. A representative dataset, VPIC, across 128 nodes showed a 64.4% read performance improvement compared to the provided Lustre installation. Also tested, was a dataset representing a global ocean salinity simulation that showed a 51.4% improvement in read performance over Lustre when using our VisIO system. VisIO, provides powerful high-performance I/O services to visualization applications, allowing for interactive performance with ultra-scale, time-series data.},

note = {LA-UR-10-07014},

keywords = {},

pubstate = {published},

tppubtype = {inproceedings}

}
Santos, Emanuele; Lins, Lauro; Ahrens, James; Freire, Juliana; Silva, Claudio T
Vismashup: Streamlining the creation of custom visualization applications Journal Article
In: Visualization and Computer Graphics, IEEE Transactions on, vol. 15, no. 6, pp. 1539–1546, 2009, (LA-UR-10-02240).
@article{santos2009vismashup,

title = {Vismashup: Streamlining the creation of custom visualization applications},

author = {Emanuele Santos and Lauro Lins and James Ahrens and Juliana Freire and Claudio T Silva},

url = {http://datascience.dsscale.org/wp-content/uploads/2016/06/VISMASHUPStreamliningTheCreationOfCustomVisualizationApplications.pdf},

year  = {2009},

date = {2009-01-01},

journal = {Visualization and Computer Graphics, IEEE Transactions on},

volume = {15},

number = {6},

pages = {1539--1546},

publisher = {IEEE},

abstract = {Visualization is essential for understanding the increasing volumes of digital data. However, the process required to create insightful visualizations is involved and time consuming. Although several visualization tools are available, including tools with sophisticated visual interfaces, they are out of reach for users who have little or no knowledge of visualization techniques and/or who do not have programming expertise. In this paper, we propose VISMASHUP, a new framework for streamlining the creation of customized visualization applications. Because these applications can be customized for very specific tasks, they can hide much of the complexity in a visualization specification and make it easier for users to explore visualizations by manipulating a small set of parameters. We describe the framework and how it supports the various tasks a designer needs to carry out to develop an application, from mining and exploring a set of visualization specifications (pipelines), to the creation of simplified views of the pipelines, and the automatic generation of the application and its interface. We also describe the implementation of the system and demonstrate its use in two real application scenarios.},

note = {LA-UR-10-02240},

keywords = {},

pubstate = {published},

tppubtype = {article}

}