2010

Ahrens, James; Fout, Nathaniel; Ma, Kwan-Liu
Time varying, multivariate volume data reduction Proceedings Article
In: 2010, (LA-UR-10-02243).
Abstract | Links | BibTeX | Tags: data reduction, multivariate, time-varying
@inproceedings{Ahrens2010,

title = {Time varying, multivariate volume data reduction},

author = {James Ahrens and Nathaniel Fout and Kwan-Liu Ma},

url = {http://datascience.dsscale.org/wp-content/uploads/2016/06/Time-VaryingMltivariateVolumeDataReduction.pdf},

year  = {2010},

date = {2010-01-01},

institution = {Los Alamos National Laboratory (LANL)},

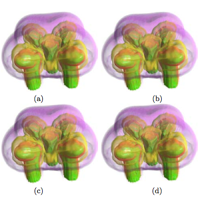
abstract = {Large-scale supercomputing is revolutionizing the way science is conducted. A growing challenge, however, is understanding the massive quantities of data produced by large-scale simulations. The data, typically time-varying, multi-variate, and volumetric, can occupy from hundreds of giga-bytes to several terabytes of storage space. Transferring and processing volume data of such sizes is prohibitively expensive and resource intensive. Although it may not be possible to entirely alleviate these problems, data compression should be considered as part of a viable solution, especially when the primary means of data analysis is volume rendering. In this paper we present our study of multivariate compression, which exploits correlations among related variables, for volume rendering. Two configurations for multidimensional compression based on vector quantization are examined. We emphasize quality reconstruction and interactive rendering, which leads us to a solution using graphics hardware to perform on-the-fly decompression during rendering.},

note = {LA-UR-10-02243},

keywords = {data reduction, multivariate, time-varying},

pubstate = {published},

tppubtype = {inproceedings}

}
2009

Woodring, Jonathan; Shen, Han-Wei
Multiscale time activity data exploration via temporal clustering visualization spreadsheet Journal Article
In: Visualization and Computer Graphics, IEEE Transactions on, vol. 15, no. 1, pp. 123–137, 2009.
Abstract | Links | BibTeX | Tags: animation, clustering, filter banks, K-means, time histogram, time-varying, transfer function, visualization spreadsheet, Wavelet
@article{woodring2009multiscale,

title = {Multiscale time activity data exploration via temporal clustering visualization spreadsheet},

author = {Jonathan Woodring and Han-Wei Shen},

url = {http://datascience.dsscale.org/wp-content/uploads/2016/06/MultiscaleTimeActivityDataExplorationViaTemporalClusteringVisualizationSpreadsheet.pdf},

year  = {2009},

date = {2009-01-01},

journal = {Visualization and Computer Graphics, IEEE Transactions on},

volume = {15},

number = {1},

pages = {123--137},

publisher = {IEEE},

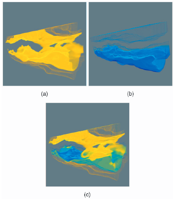
abstract = {Time-varying data is usually explored by animation or arrays of static images. Neither is particularly effective for classifying data by different temporal activities. Important temporal trends can be missed due to the lack of ability to find them with current visualization methods. In this paper, we propose a method to explore data at different temporal resolutions to discover and highlight data based upon time-varying trends. Using the wavelet transform along the time axis, we transform data points into multiscale time series curve sets. The time curves are clustered so that data of similar activity are grouped together at different temporal resolutions. The data are displayed to the user in a global time view spreadsheet, where she is able to select temporal clusters of data points and filter and brush data across temporal scales. With our method, a user can interact with data based on time activities and create expressive visualizations.},

keywords = {animation, clustering, filter banks, K-means, time histogram, time-varying, transfer function, visualization spreadsheet, Wavelet},

pubstate = {published},

tppubtype = {article}

}
2006

Woodring, Jonathan; Shen, Han-Wei
Multi-variate, time varying, and comparative visualization with contextual cues Journal Article
In: Visualization and Computer Graphics, IEEE Transactions on, vol. 12, no. 5, pp. 909–916, 2006.
Abstract | Links | BibTeX | Tags: comparative, focus + context, multi-variate, time-varying
@article{woodring2006multi,

title = {Multi-variate, time varying, and comparative visualization with contextual cues},

author = {Jonathan Woodring and Han-Wei Shen},

url = {http://datascience.dsscale.org/wp-content/uploads/2016/06/Multi-variateTime-varyingAndComparativeVisualizationWithContextualCues.pdf},

year  = {2006},

date = {2006-01-01},

journal = {Visualization and Computer Graphics, IEEE Transactions on},

volume = {12},

number = {5},

pages = {909--916},

publisher = {IEEE},

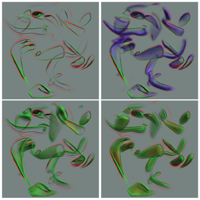
abstract = {Time-varying, multi-variate, and comparative data sets are not easily visualized due to the amount of data that is presented to the user at once. By combining several volumes together with different operators into one visualized volume, the user is able to compare values from different data sets in space over time, run, or field without having to mentally switch between different renderings of individual data sets. In this paper, we propose using a volume shader where the user is given the ability to easily select and operate on many data volumes to create comparison relationships. The user specifies an expression with set and numerical operations and her data to see relationships between data fields. Furthermore, we render the contextual information of the volume shader by converting it to a volume tree. We visualize the different levels and nodes of the volume tree so that the user can see the results of suboperations. This gives the user a deeper understanding of the final visualization, by seeing how the parts of the whole are operationally constructed.},

keywords = {comparative, focus + context, multi-variate, time-varying},

pubstate = {published},

tppubtype = {article}

}
Ahrens, James; Fout, Nathaniel; Ma, Kwan-Liu
Time varying, multivariate volume data reduction Proceedings Article
In: 2010, (LA-UR-10-02243).
@inproceedings{Ahrens2010,

title = {Time varying, multivariate volume data reduction},

author = {James Ahrens and Nathaniel Fout and Kwan-Liu Ma},

url = {http://datascience.dsscale.org/wp-content/uploads/2016/06/Time-VaryingMltivariateVolumeDataReduction.pdf},

year  = {2010},

date = {2010-01-01},

institution = {Los Alamos National Laboratory (LANL)},

abstract = {Large-scale supercomputing is revolutionizing the way science is conducted. A growing challenge, however, is understanding the massive quantities of data produced by large-scale simulations. The data, typically time-varying, multi-variate, and volumetric, can occupy from hundreds of giga-bytes to several terabytes of storage space. Transferring and processing volume data of such sizes is prohibitively expensive and resource intensive. Although it may not be possible to entirely alleviate these problems, data compression should be considered as part of a viable solution, especially when the primary means of data analysis is volume rendering. In this paper we present our study of multivariate compression, which exploits correlations among related variables, for volume rendering. Two configurations for multidimensional compression based on vector quantization are examined. We emphasize quality reconstruction and interactive rendering, which leads us to a solution using graphics hardware to perform on-the-fly decompression during rendering.},

note = {LA-UR-10-02243},

keywords = {},

pubstate = {published},

tppubtype = {inproceedings}

}
Woodring, Jonathan; Shen, Han-Wei
Multiscale time activity data exploration via temporal clustering visualization spreadsheet Journal Article
In: Visualization and Computer Graphics, IEEE Transactions on, vol. 15, no. 1, pp. 123–137, 2009.
@article{woodring2009multiscale,

title = {Multiscale time activity data exploration via temporal clustering visualization spreadsheet},

author = {Jonathan Woodring and Han-Wei Shen},

url = {http://datascience.dsscale.org/wp-content/uploads/2016/06/MultiscaleTimeActivityDataExplorationViaTemporalClusteringVisualizationSpreadsheet.pdf},

year  = {2009},

date = {2009-01-01},

journal = {Visualization and Computer Graphics, IEEE Transactions on},

volume = {15},

number = {1},

pages = {123--137},

publisher = {IEEE},

abstract = {Time-varying data is usually explored by animation or arrays of static images. Neither is particularly effective for classifying data by different temporal activities. Important temporal trends can be missed due to the lack of ability to find them with current visualization methods. In this paper, we propose a method to explore data at different temporal resolutions to discover and highlight data based upon time-varying trends. Using the wavelet transform along the time axis, we transform data points into multiscale time series curve sets. The time curves are clustered so that data of similar activity are grouped together at different temporal resolutions. The data are displayed to the user in a global time view spreadsheet, where she is able to select temporal clusters of data points and filter and brush data across temporal scales. With our method, a user can interact with data based on time activities and create expressive visualizations.},

keywords = {},

pubstate = {published},

tppubtype = {article}

}
Woodring, Jonathan; Shen, Han-Wei
Multi-variate, time varying, and comparative visualization with contextual cues Journal Article
In: Visualization and Computer Graphics, IEEE Transactions on, vol. 12, no. 5, pp. 909–916, 2006.
@article{woodring2006multi,

title = {Multi-variate, time varying, and comparative visualization with contextual cues},

author = {Jonathan Woodring and Han-Wei Shen},

url = {http://datascience.dsscale.org/wp-content/uploads/2016/06/Multi-variateTime-varyingAndComparativeVisualizationWithContextualCues.pdf},

year  = {2006},

date = {2006-01-01},

journal = {Visualization and Computer Graphics, IEEE Transactions on},

volume = {12},

number = {5},

pages = {909--916},

publisher = {IEEE},

abstract = {Time-varying, multi-variate, and comparative data sets are not easily visualized due to the amount of data that is presented to the user at once. By combining several volumes together with different operators into one visualized volume, the user is able to compare values from different data sets in space over time, run, or field without having to mentally switch between different renderings of individual data sets. In this paper, we propose using a volume shader where the user is given the ability to easily select and operate on many data volumes to create comparison relationships. The user specifies an expression with set and numerical operations and her data to see relationships between data fields. Furthermore, we render the contextual information of the volume shader by converting it to a volume tree. We visualize the different levels and nodes of the volume tree so that the user can see the results of suboperations. This gives the user a deeper understanding of the final visualization, by seeing how the parts of the whole are operationally constructed.},

keywords = {},

pubstate = {published},

tppubtype = {article}

}