2009
Woodring, Jonathan; Shen, Han-Wei
Multiscale time activity data exploration via temporal clustering visualization spreadsheet Journal Article
In: Visualization and Computer Graphics, IEEE Transactions on, vol. 15, no. 1, pp. 123–137, 2009.
Abstract | Links | BibTeX | Tags: animation, clustering, filter banks, K-means, time histogram, time-varying, transfer function, visualization spreadsheet, Wavelet
@article{woodring2009multiscale,
title = {Multiscale time activity data exploration via temporal clustering visualization spreadsheet},
author = {Jonathan Woodring and Han-Wei Shen},
url = {http://datascience.dsscale.org/wp-content/uploads/2016/06/MultiscaleTimeActivityDataExplorationViaTemporalClusteringVisualizationSpreadsheet.pdf},
year = {2009},
date = {2009-01-01},
journal = {Visualization and Computer Graphics, IEEE Transactions on},
volume = {15},
number = {1},
pages = {123--137},
publisher = {IEEE},
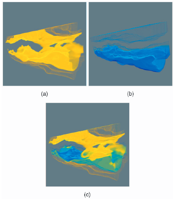
abstract = {Time-varying data is usually explored by animation or arrays of static images. Neither is particularly effective for classifying data by different temporal activities. Important temporal trends can be missed due to the lack of ability to find them with current visualization methods. In this paper, we propose a method to explore data at different temporal resolutions to discover and highlight data based upon time-varying trends. Using the wavelet transform along the time axis, we transform data points into multiscale time series curve sets. The time curves are clustered so that data of similar activity are grouped together at different temporal resolutions. The data are displayed to the user in a global time view spreadsheet, where she is able to select temporal clusters of data points and filter and brush data across temporal scales. With our method, a user can interact with data based on time activities and create expressive visualizations.},
keywords = {animation, clustering, filter banks, K-means, time histogram, time-varying, transfer function, visualization spreadsheet, Wavelet},
pubstate = {published},
tppubtype = {article}
}
2007
Woodring, Jonathan; Shen, Han-Wei
Incorporating highlighting animations into static visualizations Proceedings Article
In: Electronic Imaging 2007, pp. 649503–649503, International Society for Optics and Photonics 2007.
Abstract | Links | BibTeX | Tags: animation, highlighting, visualization
@inproceedings{woodring2007incorporating,
title = {Incorporating highlighting animations into static visualizations},
author = {Jonathan Woodring and Han-Wei Shen},
url = {http://datascience.dsscale.org/wp-content/uploads/2016/06/IncorporatingHighlightingAnimationsIntoStaticVisualizations.pdf},
year = {2007},
date = {2007-01-01},
booktitle = {Electronic Imaging 2007},
pages = {649503--649503},
organization = {International Society for Optics and Photonics},
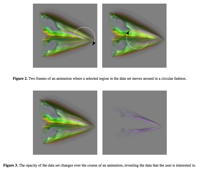
abstract = {Rendering a lot of data results in cluttered visualizations. It is difficult for a user to find regions of interest from contextual data especially when occlusion is considered. We incorporate animations into visualization by adding positional motion and opacity change as a highlighting mechanism. By leveraging our knowledge on motion perception, we can help a user to visually filter out her selected data by rendering it with animation. Our framework of adding animation is the animation transfer function, where it provides a mapping from data and animation frame index to a changing visual property. The animation transfer function describes animations for user selected regions of interest. In addition to our framework, we explain the implementation of animations as a modification of the rendering pipeline. The animation rendering pipeline allows us to easily incorporate animations into existing software and hardware based volume renderers.},
keywords = {animation, highlighting, visualization},
pubstate = {published},
tppubtype = {inproceedings}
}
Woodring, Jonathan; Shen, Han-Wei
Multiscale time activity data exploration via temporal clustering visualization spreadsheet Journal Article
In: Visualization and Computer Graphics, IEEE Transactions on, vol. 15, no. 1, pp. 123–137, 2009.
@article{woodring2009multiscale,

title = {Multiscale time activity data exploration via temporal clustering visualization spreadsheet},

author = {Jonathan Woodring and Han-Wei Shen},

url = {http://datascience.dsscale.org/wp-content/uploads/2016/06/MultiscaleTimeActivityDataExplorationViaTemporalClusteringVisualizationSpreadsheet.pdf},

year  = {2009},

date = {2009-01-01},

journal = {Visualization and Computer Graphics, IEEE Transactions on},

volume = {15},

number = {1},

pages = {123--137},

publisher = {IEEE},

abstract = {Time-varying data is usually explored by animation or arrays of static images. Neither is particularly effective for classifying data by different temporal activities. Important temporal trends can be missed due to the lack of ability to find them with current visualization methods. In this paper, we propose a method to explore data at different temporal resolutions to discover and highlight data based upon time-varying trends. Using the wavelet transform along the time axis, we transform data points into multiscale time series curve sets. The time curves are clustered so that data of similar activity are grouped together at different temporal resolutions. The data are displayed to the user in a global time view spreadsheet, where she is able to select temporal clusters of data points and filter and brush data across temporal scales. With our method, a user can interact with data based on time activities and create expressive visualizations.},

keywords = {},

pubstate = {published},

tppubtype = {article}

}
Woodring, Jonathan; Shen, Han-Wei
Incorporating highlighting animations into static visualizations Proceedings Article
In: Electronic Imaging 2007, pp. 649503–649503, International Society for Optics and Photonics 2007.
@inproceedings{woodring2007incorporating,

title = {Incorporating highlighting animations into static visualizations},

author = {Jonathan Woodring and Han-Wei Shen},

url = {http://datascience.dsscale.org/wp-content/uploads/2016/06/IncorporatingHighlightingAnimationsIntoStaticVisualizations.pdf},

year  = {2007},

date = {2007-01-01},

booktitle = {Electronic Imaging 2007},

pages = {649503--649503},

organization = {International Society for Optics and Photonics},

abstract = {Rendering a lot of data results in cluttered visualizations. It is difficult for a user to find regions of interest from contextual data especially when occlusion is considered. We incorporate animations into visualization by adding positional motion and opacity change as a highlighting mechanism. By leveraging our knowledge on motion perception, we can help a user to visually filter out her selected data by rendering it with animation. Our framework of adding animation is the animation transfer function, where it provides a mapping from data and animation frame index to a changing visual property. The animation transfer function describes animations for user selected regions of interest. In addition to our framework, we explain the implementation of animations as a modification of the rendering pipeline. The animation rendering pipeline allows us to easily incorporate animations into existing software and hardware based volume renderers.},

keywords = {},

pubstate = {published},

tppubtype = {inproceedings}

}