2020
Orban, Daniel; Banesh, Divya; Banesh, Cameron; Biwer, Christopher; Biswas, Ayan; Saavedra, Ramon; Sweeney, Christine; Sandberg, Richard; Bolme, C A; Ahrens, James; Rogers, David
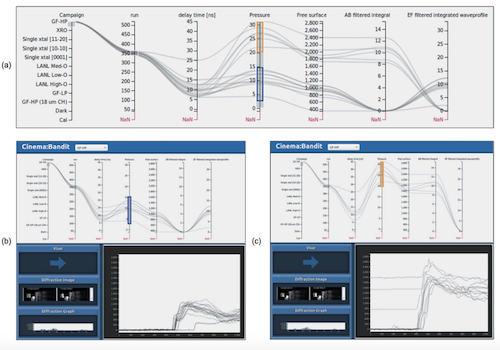
Cinema:Bandit: a visualization application for beamline science demonstrated on XFEL shock physics experiments Journal Article
In: Journal of Synchrotron Radiation, vol. 27, no. 1, 2020.
Abstract | Links | BibTeX | Tags: continuous workflow, data visualization, database, real time, XFEL
@article{Orban:yn5053,

title = {Cinema:Bandit: a visualization application for beamline science demonstrated on XFEL shock physics experiments},

author = {Daniel Orban and Divya Banesh and Cameron Banesh and Christopher Biwer and Ayan Biswas and Ramon Saavedra and Christine Sweeney and Richard Sandberg and C A Bolme and James Ahrens and David Rogers},

url = {https://doi.org/10.1107/S1600577519014322

https://dsscale.org/wp-content/uploads/2019/12/Cinema-Bandit-a-visualization-application-for-beamline-science-demonstrated-on-XFEL-shock-physics-experiments.pdf},

doi = {10.1107/S1600577519014322},

year  = {2020},

date = {2020-01-01},

journal = {Journal of Synchrotron Radiation},

volume = {27},

number = {1},

abstract = {A new visualization tool, Cinema:Bandit, and its demonstration with a continuous workflow for analyzing shock physics experiments and visually exploring the data in real time at X-ray light sources is presented. it Cinema:Bandit is an open-source, web-based visualization application in which the experimenter may explore an aggregated dataset to inform real-time beamline decisions and enable it post hoc data analysis. The tool integrates with experimental workflows that process raw detector data into a simple database format, and it allows visualization of disparate data types, including experimental parameters, line graphs, and images. Use of parallel coordinates accommodates the irregular sampling of experimental parameters and allows for display and filtering of both experimental inputs and measurements. The tool is demonstrated on a dataset of shock-compressed titanium collected at the Matter in Extreme Conditions hutch at the Linac Coherent Light Source.},

keywords = {continuous workflow, data visualization, database, real time, XFEL},

pubstate = {published},

tppubtype = {article}

}
2017
Dutta, Soumya; Woodring, Jon; Shen, Han-Wei; Chen, Jen-Ping; Ahrens, James
Homogeneity guided probabilistic data summaries for analysis and visualization of large-scale data sets Proceedings Article
In: 2017 IEEE Pacific Visualization Symposium (PacificVis), pp. 111-120, 2017, ISSN: 2165-8773, (LA-UR-18-27370).
Abstract | Links | BibTeX | Tags: data visualization, picture/image generation, statistical computing
@inproceedings{8031585,

title = {Homogeneity guided probabilistic data summaries for analysis and visualization of large-scale data sets},

author = {Soumya Dutta and Jon Woodring and Han-Wei Shen and Jen-Ping Chen and James Ahrens},

url = {https://datascience.dsscale.org/wp-content/uploads/2018/08/la-ur_18-27370.pdf},

doi = {10.1109/PACIFICVIS.2017.8031585},

issn = {2165-8773},

year  = {2017},

date = {2017-04-01},

booktitle = {2017 IEEE Pacific Visualization Symposium (PacificVis)},

pages = {111-120},

abstract = {High-resolution simulation data sets provide plethora of information, which needs to be explored by application scientists to gain enhanced understanding about various phenomena. Visual-analytics techniques using raw data sets are often expensive due to the data sets' extreme sizes. But, interactive analysis and visualization is crucial for big data analytics, because scientists can then focus on the important data and make critical decisions quickly. To assist efficient exploration and visualization, we propose a new region-based statistical data summarization scheme. Our method is superior in quality, as compared to the existing statistical summarization techniques, with a more compact representation, reducing the overall storage cost. The quantitative and visual efficacy of our proposed method is demonstrated using several data sets along with an in situ application study for an extreme-scale flow simulation.},

note = {LA-UR-18-27370},

keywords = {data visualization, picture/image generation, statistical computing},

pubstate = {published},

tppubtype = {inproceedings}

}
2001
Keahey, Alan; McCormick, Patrick; Ahrens, James; Keahey, Katarzyna
Qviz: a framework for querying and visualizing data Proceedings Article
In: Photonics West 2001-Electronic Imaging, pp. 259–267, International Society for Optics and Photonics 2001, (LA-UR-00-6116).
Abstract | Links | BibTeX | Tags: analytical queries, data visualization, multivariate visualization, parallel processing
@inproceedings{keahey2001qviz,

title = {Qviz: a framework for querying and visualizing data},

author = {Alan Keahey and Patrick McCormick and James Ahrens and Katarzyna Keahey},

url = {http://datascience.dsscale.org/wp-content/uploads/2016/06/QvizAFrameworkForQueryingAndVisualizaingData.pdf},

year  = {2001},

date = {2001-01-01},

booktitle = {Photonics West 2001-Electronic Imaging},

pages = {259--267},

organization = {International Society for Optics and Photonics},

abstract = {Qviz is a lightweight, modular, and easy to use parallel system for interactive analytical query processing and visual presentation of large datasets. Qviz allows queries of arbitrary complexity to be easily constructed using a specialized scripting language. Visual presentation of the results is also easily achived via simple scripted and interactive commands to our query-specific visualization tools. This paper describes our initial experiences with the Qviz system for querying and visualizing scientific datasets, showing how Qviz has been used in two different applications: ocean modeling and linear accelerator simulations.},

note = {LA-UR-00-6116},

keywords = {analytical queries, data visualization, multivariate visualization, parallel processing},

pubstate = {published},

tppubtype = {inproceedings}

}
Orban, Daniel; Banesh, Divya; Banesh, Cameron; Biwer, Christopher; Biswas, Ayan; Saavedra, Ramon; Sweeney, Christine; Sandberg, Richard; Bolme, C A; Ahrens, James; Rogers, David
Cinema:Bandit: a visualization application for beamline science demonstrated on XFEL shock physics experiments Journal Article
In: Journal of Synchrotron Radiation, vol. 27, no. 1, 2020.
@article{Orban:yn5053,

title = {Cinema:Bandit: a visualization application for beamline science demonstrated on XFEL shock physics experiments},

author = {Daniel Orban and Divya Banesh and Cameron Banesh and Christopher Biwer and Ayan Biswas and Ramon Saavedra and Christine Sweeney and Richard Sandberg and C A Bolme and James Ahrens and David Rogers},

url = {https://doi.org/10.1107/S1600577519014322

https://dsscale.org/wp-content/uploads/2019/12/Cinema-Bandit-a-visualization-application-for-beamline-science-demonstrated-on-XFEL-shock-physics-experiments.pdf},

doi = {10.1107/S1600577519014322},

year  = {2020},

date = {2020-01-01},

journal = {Journal of Synchrotron Radiation},

volume = {27},

number = {1},

abstract = {A new visualization tool, Cinema:Bandit, and its demonstration with a continuous workflow for analyzing shock physics experiments and visually exploring the data in real time at X-ray light sources is presented. it Cinema:Bandit is an open-source, web-based visualization application in which the experimenter may explore an aggregated dataset to inform real-time beamline decisions and enable it post hoc data analysis. The tool integrates with experimental workflows that process raw detector data into a simple database format, and it allows visualization of disparate data types, including experimental parameters, line graphs, and images. Use of parallel coordinates accommodates the irregular sampling of experimental parameters and allows for display and filtering of both experimental inputs and measurements. The tool is demonstrated on a dataset of shock-compressed titanium collected at the Matter in Extreme Conditions hutch at the Linac Coherent Light Source.},

keywords = {},

pubstate = {published},

tppubtype = {article}

}
Dutta, Soumya; Woodring, Jon; Shen, Han-Wei; Chen, Jen-Ping; Ahrens, James
Homogeneity guided probabilistic data summaries for analysis and visualization of large-scale data sets Proceedings Article
In: 2017 IEEE Pacific Visualization Symposium (PacificVis), pp. 111-120, 2017, ISSN: 2165-8773, (LA-UR-18-27370).
@inproceedings{8031585,

title = {Homogeneity guided probabilistic data summaries for analysis and visualization of large-scale data sets},

author = {Soumya Dutta and Jon Woodring and Han-Wei Shen and Jen-Ping Chen and James Ahrens},

url = {https://datascience.dsscale.org/wp-content/uploads/2018/08/la-ur_18-27370.pdf},

doi = {10.1109/PACIFICVIS.2017.8031585},

issn = {2165-8773},

year  = {2017},

date = {2017-04-01},

booktitle = {2017 IEEE Pacific Visualization Symposium (PacificVis)},

pages = {111-120},

abstract = {High-resolution simulation data sets provide plethora of information, which needs to be explored by application scientists to gain enhanced understanding about various phenomena. Visual-analytics techniques using raw data sets are often expensive due to the data sets' extreme sizes. But, interactive analysis and visualization is crucial for big data analytics, because scientists can then focus on the important data and make critical decisions quickly. To assist efficient exploration and visualization, we propose a new region-based statistical data summarization scheme. Our method is superior in quality, as compared to the existing statistical summarization techniques, with a more compact representation, reducing the overall storage cost. The quantitative and visual efficacy of our proposed method is demonstrated using several data sets along with an in situ application study for an extreme-scale flow simulation.},

note = {LA-UR-18-27370},

keywords = {},

pubstate = {published},

tppubtype = {inproceedings}

}
Keahey, Alan; McCormick, Patrick; Ahrens, James; Keahey, Katarzyna
Qviz: a framework for querying and visualizing data Proceedings Article
In: Photonics West 2001-Electronic Imaging, pp. 259–267, International Society for Optics and Photonics 2001, (LA-UR-00-6116).
@inproceedings{keahey2001qviz,

title = {Qviz: a framework for querying and visualizing data},

author = {Alan Keahey and Patrick McCormick and James Ahrens and Katarzyna Keahey},

url = {http://datascience.dsscale.org/wp-content/uploads/2016/06/QvizAFrameworkForQueryingAndVisualizaingData.pdf},

year  = {2001},

date = {2001-01-01},

booktitle = {Photonics West 2001-Electronic Imaging},

pages = {259--267},

organization = {International Society for Optics and Photonics},

abstract = {Qviz is a lightweight, modular, and easy to use parallel system for interactive analytical query processing and visual presentation of large datasets. Qviz allows queries of arbitrary complexity to be easily constructed using a specialized scripting language. Visual presentation of the results is also easily achived via simple scripted and interactive commands to our query-specific visualization tools. This paper describes our initial experiences with the Qviz system for querying and visualizing scientific datasets, showing how Qviz has been used in two different applications: ocean modeling and linear accelerator simulations.},

note = {LA-UR-00-6116},

keywords = {},

pubstate = {published},

tppubtype = {inproceedings}

}