2014
Nouanesengsy, Boonthanome; Woodring, Jonathan; Patchett, John; Myers, Kary; Ahrens, James
ADR visualization: A generalized framework for ranking large-scale scientific data using Analysis-Driven Refinement Proceedings Article
In: Large Data Analysis and Visualization (LDAV), 2014 IEEE 4th Symposium on, pp. 43–50, IEEE 2014, (LA-UR-pending).
Abstract | Links | BibTeX | Tags: adaptive mesh refinement, ADR, Analysis-Driven Refinement, big data, data triage, focus+context, hardware architecture, large-scale data, parallel processing, picture/image generation, prioritization, scientific data, viewing algorithms
@inproceedings{nouanesengsy2014adr,
title = {ADR visualization: A generalized framework for ranking large-scale scientific data using Analysis-Driven Refinement},
author = {Boonthanome Nouanesengsy and Jonathan Woodring and John Patchett and Kary Myers and James Ahrens},
url = {http://datascience.dsscale.org/wp-content/uploads/2016/06/ADRVisualization.pdf},
year = {2014},
date = {2014-01-01},
booktitle = {Large Data Analysis and Visualization (LDAV), 2014 IEEE 4th Symposium on},
pages = {43--50},
organization = {IEEE},
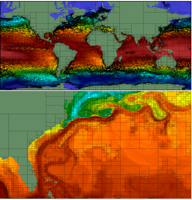
abstract = {Prioritization of data is necessary for managing large-scale scien- tific data, as the scale of the data implies that there are only enough resources available to process a limited subset of the data. For ex- ample, data prioritization is used during in situ triage to scale with bandwidth bottlenecks, and used during focus+context visualiza- tion to save time during analysis by guiding the user to impor- tant information. In this paper, we present ADR visualization, a generalized analysis framework for ranking large-scale data using Analysis-Driven Refinement (ADR), which is inspired by Adaptive Mesh Refinement (AMR). A large-scale data set is partitioned in space, time, and variable, using user-defined importance measure- ments for prioritization. This process creates a prioritization tree over the data set. Using this tree, selection methods can generate sparse data products for analysis, such as focus+context visualiza- tions or sparse data sets.},
note = {LA-UR-pending},
keywords = {adaptive mesh refinement, ADR, Analysis-Driven Refinement, big data, data triage, focus+context, hardware architecture, large-scale data, parallel processing, picture/image generation, prioritization, scientific data, viewing algorithms},
pubstate = {published},
tppubtype = {inproceedings}
}
2003
Woodring, Jonathan; Shen, Han-Wei
Chronovolumes: A Direct Rendering Technique for Visualizing Time-varying Data Proceedings Article
In: Proceedings of the 2003 Eurographics/IEEE TVCG Workshop on Volume Graphics, pp. 27–34, ACM, Tokyo, Japan, 2003, ISBN: 1-58113-745-1.
Abstract | Links | BibTeX | Tags: viewing algorithms
@inproceedings{Woodring:2003:CDR:827051.827054,
title = {Chronovolumes: A Direct Rendering Technique for Visualizing Time-varying Data},
author = {Jonathan Woodring and Han-Wei Shen},
url = {http://datascience.dsscale.org/wp-content/uploads/2016/06/Chronovolumes.pdf
http://doi.acm.org/10.1145/827051.827054},
doi = {10.1145/827051.827054},
isbn = {1-58113-745-1},
year = {2003},
date = {2003-01-01},
booktitle = {Proceedings of the 2003 Eurographics/IEEE TVCG Workshop on Volume Graphics},
pages = {27--34},
publisher = {ACM},
address = {Tokyo, Japan},
series = {VG '03},
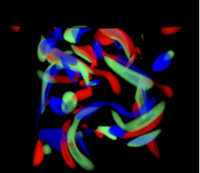
abstract = {We present a new method for displaying time varying volumetric data. The core of the algorithm is an integration through time producing a single view volume that captures the essence of multiple time steps in a sequence. The resulting view volume then can be viewed with traditional raycasting techniques. With different time integration functions, we can generate several kinds of resulting chronovolumes, which illustrate differing types of time vary- ing features to the user. By utilizing graphics hardware and texture memory, the integration through time can be sped up, allowing the user interactive control over the temporal transfer function and exploration of the data.},
keywords = {viewing algorithms},
pubstate = {published},
tppubtype = {inproceedings}
}
Nouanesengsy, Boonthanome; Woodring, Jonathan; Patchett, John; Myers, Kary; Ahrens, James
ADR visualization: A generalized framework for ranking large-scale scientific data using Analysis-Driven Refinement Proceedings Article
In: Large Data Analysis and Visualization (LDAV), 2014 IEEE 4th Symposium on, pp. 43–50, IEEE 2014, (LA-UR-pending).
@inproceedings{nouanesengsy2014adr,

title = {ADR visualization: A generalized framework for ranking large-scale scientific data using Analysis-Driven Refinement},

author = {Boonthanome Nouanesengsy and Jonathan Woodring and John Patchett and Kary Myers and James Ahrens},

url = {http://datascience.dsscale.org/wp-content/uploads/2016/06/ADRVisualization.pdf},

year  = {2014},

date = {2014-01-01},

booktitle = {Large Data Analysis and Visualization (LDAV), 2014 IEEE 4th Symposium on},

pages = {43--50},

organization = {IEEE},

abstract = {Prioritization of data is necessary for managing large-scale scien- tific data, as the scale of the data implies that there are only enough resources available to process a limited subset of the data. For ex- ample, data prioritization is used during in situ triage to scale with bandwidth bottlenecks, and used during focus+context visualiza- tion to save time during analysis by guiding the user to impor- tant information. In this paper, we present ADR visualization, a generalized analysis framework for ranking large-scale data using Analysis-Driven Refinement (ADR), which is inspired by Adaptive Mesh Refinement (AMR). A large-scale data set is partitioned in space, time, and variable, using user-defined importance measure- ments for prioritization. This process creates a prioritization tree over the data set. Using this tree, selection methods can generate sparse data products for analysis, such as focus+context visualiza- tions or sparse data sets.},

note = {LA-UR-pending},

keywords = {},

pubstate = {published},

tppubtype = {inproceedings}

}
Woodring, Jonathan; Shen, Han-Wei
Chronovolumes: A Direct Rendering Technique for Visualizing Time-varying Data Proceedings Article
In: Proceedings of the 2003 Eurographics/IEEE TVCG Workshop on Volume Graphics, pp. 27–34, ACM, Tokyo, Japan, 2003, ISBN: 1-58113-745-1.
@inproceedings{Woodring:2003:CDR:827051.827054,

title = {Chronovolumes: A Direct Rendering Technique for Visualizing Time-varying Data},

author = {Jonathan Woodring and Han-Wei Shen},

url = {http://datascience.dsscale.org/wp-content/uploads/2016/06/Chronovolumes.pdf

http://doi.acm.org/10.1145/827051.827054},

doi = {10.1145/827051.827054},

isbn = {1-58113-745-1},

year  = {2003},

date = {2003-01-01},

booktitle = {Proceedings of the 2003 Eurographics/IEEE TVCG Workshop on Volume Graphics},

pages = {27--34},

publisher = {ACM},

address = {Tokyo, Japan},

series = {VG '03},

abstract = {We present a new method for displaying time varying volumetric data. The core of the algorithm is an integration through time producing a single view volume that captures the essence of multiple time steps in a sequence. The resulting view volume then can be viewed with traditional raycasting techniques. With different time integration functions, we can generate several kinds of resulting chronovolumes, which illustrate differing types of time vary- ing features to the user. By utilizing graphics hardware and texture memory, the integration through time can be sped up, allowing the user interactive control over the temporal transfer function and exploration of the data.},

keywords = {},

pubstate = {published},

tppubtype = {inproceedings}

}