2017
Berres, Anne; Adhinarayanan, Vignesh; Turton, Terece; Feng, Wu; Rogers, David
A Pipeline for Large Data Processing Using Regular Sampling for Unstructured Grids Proceedings Article
In: 2017, (LA-UR-17-23903).
Abstract | Links | BibTeX | Tags: large-scale data, visualization
@inproceedings{info:lanl-repo/lareport/LA-UR-17-23903,
title = {A Pipeline for Large Data Processing Using Regular Sampling for Unstructured Grids},
author = {Anne Berres and Vignesh Adhinarayanan and Terece Turton and Wu Feng and David Rogers},
url = {http://datascience.dsscale.org/wp-content/uploads/2017/08/LA-UR-17-23903.pdf},
year = {2017},
date = {2017-05-12},
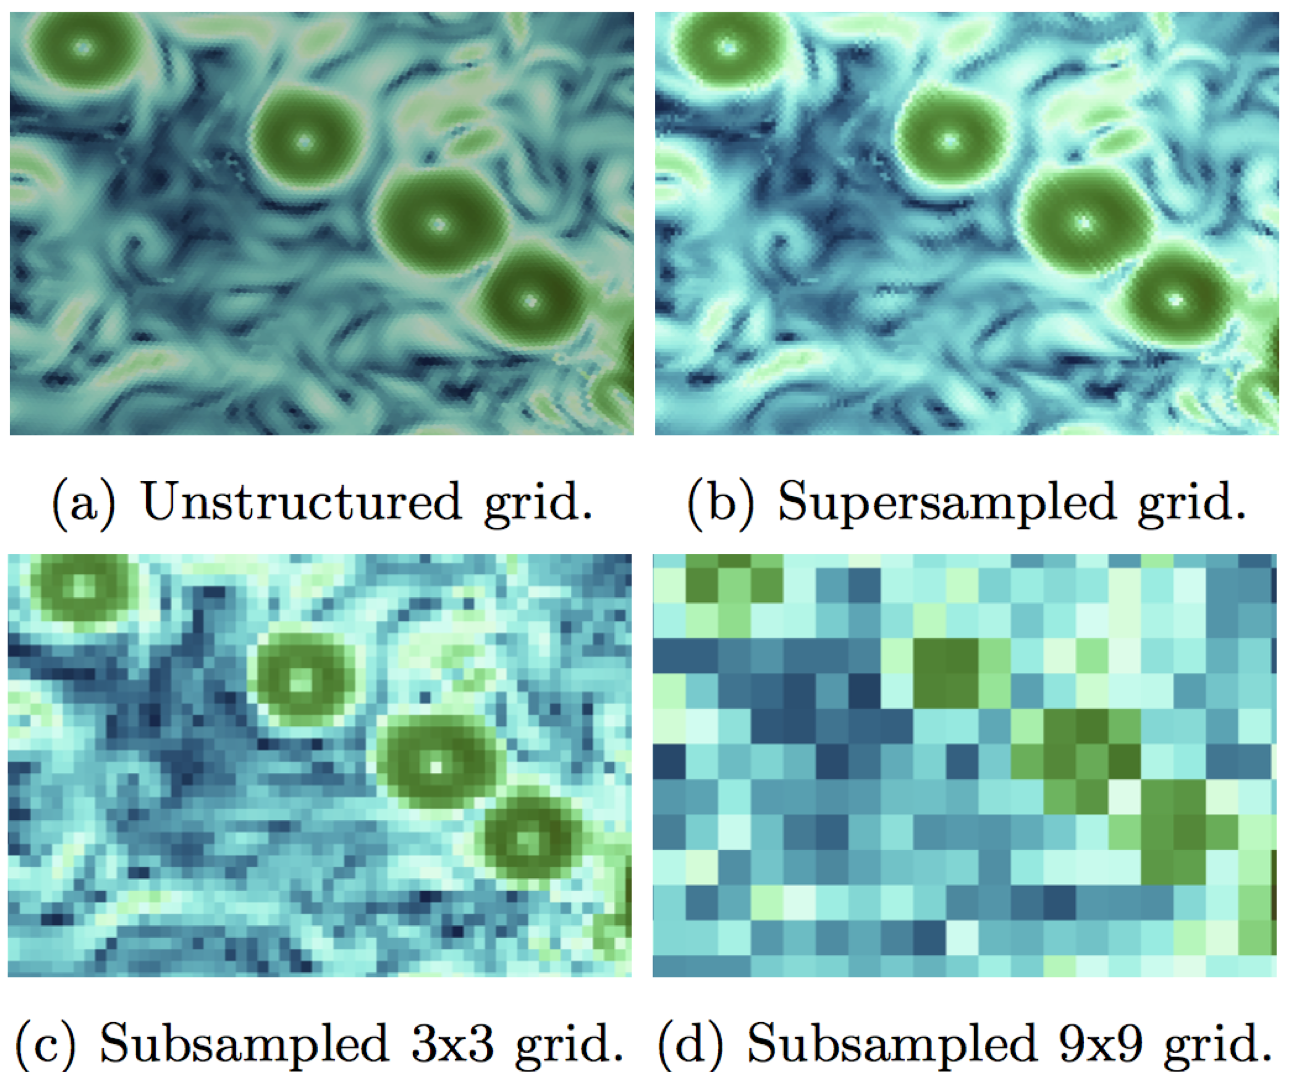
abstract = {Large simulation data requires a lot of time and computational resources to compute, store, analyze, visualize, and run user studies. Today, the largest cost of a supercomputer is not hardware but maintenance, in particular energy consumption. Our goal is to balance energy consumption and cognitive value of visualizations of resulting data. This requires us to go through the entire processing pipeline, from simulation to user studies. To reduce the amount of resources, data can be sampled or compressed. While this adds more computation time, the computational overhead is negligible compared to the simulation time. We built a processing pipeline at the example of regular sampling. The reasons for this choice are two-fold: using a simple example reduces unnecessary complexity as we know what to expect from the results. Furthermore, it provides a good baseline for future, more elaborate sampling methods. We measured time and energy for each test we did, and we conducted user studies in Amazon Mechanical Turk (AMT) for a range of different results we produced through sampling.
},
note = {LA-UR-17-23903},
keywords = {large-scale data, visualization},
pubstate = {published},
tppubtype = {inproceedings}
}
2016
Ahrens, James Paul
01.11.2016, (Chesapeake Large-Scale Analytics Conference - CLSAC 2016, LA-UR-16-28491).
Abstract | Links | BibTeX | Tags: large-scale data, ParaView, VTK
@misc{Ahrens_2016,

title = {Towards a Scalable, Platform Independent, User-Friendly Analysis Framework for Scientific and Information Oriented Applications},

author = {James Paul Ahrens},

url = {http://datascience.dsscale.org/wp-content/uploads/2017/08/LA-UR-16-28491.pdf},

year  = {2016},

date = {2016-11-01},

abstract = {Options for extreme scale data analysis are often presented as a stark contrast: write large files to disk for interactive exploratory analysis, or perform in situ analysis to save detailed data about phenomena that a user knows about in advance. We describe a novel framework that offers a middle ground - a highly interactive approach that promotes exploration of extracts from source data streams that significantly reduces data movement and storage. This framework is built upon a collection of scalable, platform independent, open-source packages (vtk and ParaView) that have been developed of the past two decades. In this talk, I will describe these frameworks, connections to information oriented streaming approaches, and highlight applications to real-world analysis challenges.},

note = {Chesapeake Large-Scale Analytics Conference - CLSAC 2016, LA-UR-16-28491},

keywords = {large-scale data, ParaView, VTK},

pubstate = {published},

tppubtype = {presentation}

}
2014
Nouanesengsy, Boonthanome; Woodring, Jonathan; Patchett, John; Myers, Kary; Ahrens, James
ADR visualization: A generalized framework for ranking large-scale scientific data using Analysis-Driven Refinement Proceedings Article
In: Large Data Analysis and Visualization (LDAV), 2014 IEEE 4th Symposium on, pp. 43–50, IEEE 2014, (LA-UR-pending).
Abstract | Links | BibTeX | Tags: adaptive mesh refinement, ADR, Analysis-Driven Refinement, big data, data triage, focus+context, hardware architecture, large-scale data, parallel processing, picture/image generation, prioritization, scientific data, viewing algorithms
@inproceedings{nouanesengsy2014adr,

title = {ADR visualization: A generalized framework for ranking large-scale scientific data using Analysis-Driven Refinement},

author = {Boonthanome Nouanesengsy and Jonathan Woodring and John Patchett and Kary Myers and James Ahrens},

url = {http://datascience.dsscale.org/wp-content/uploads/2016/06/ADRVisualization.pdf},

year  = {2014},

date = {2014-01-01},

booktitle = {Large Data Analysis and Visualization (LDAV), 2014 IEEE 4th Symposium on},

pages = {43--50},

organization = {IEEE},

abstract = {Prioritization of data is necessary for managing large-scale scien- tific data, as the scale of the data implies that there are only enough resources available to process a limited subset of the data. For ex- ample, data prioritization is used during in situ triage to scale with bandwidth bottlenecks, and used during focus+context visualiza- tion to save time during analysis by guiding the user to impor- tant information. In this paper, we present ADR visualization, a generalized analysis framework for ranking large-scale data using Analysis-Driven Refinement (ADR), which is inspired by Adaptive Mesh Refinement (AMR). A large-scale data set is partitioned in space, time, and variable, using user-defined importance measure- ments for prioritization. This process creates a prioritization tree over the data set. Using this tree, selection methods can generate sparse data products for analysis, such as focus+context visualiza- tions or sparse data sets.},

note = {LA-UR-pending},

keywords = {adaptive mesh refinement, ADR, Analysis-Driven Refinement, big data, data triage, focus+context, hardware architecture, large-scale data, parallel processing, picture/image generation, prioritization, scientific data, viewing algorithms},

pubstate = {published},

tppubtype = {inproceedings}

}
2010
Patchett, John; Ahrens, James; Lo, Li-Ta; Browniee, Carson; Mitchell, Christopher; Hansen, Chuck
Approaching the Exa-Scale: a Real-World Evaluation of Rendering Extremely Large Data Sets Journal Article
In: 2010.
Abstract | Links | BibTeX | Tags: exascale, large-scale data
@article{Patchett_Ahrens_Lo_Browniee_Mitchell_Hansen_2010,
title = {Approaching the Exa-Scale: a Real-World Evaluation of Rendering Extremely Large Data Sets},
author = {John Patchett and James Ahrens and Li-Ta Lo and Carson Browniee and Christopher Mitchell and Chuck Hansen},
url = {http://datascience.dsscale.org/wp-content/uploads/2017/09/LA-UR-10-07016.pdf},
year = {2010},
date = {2010-10-01},
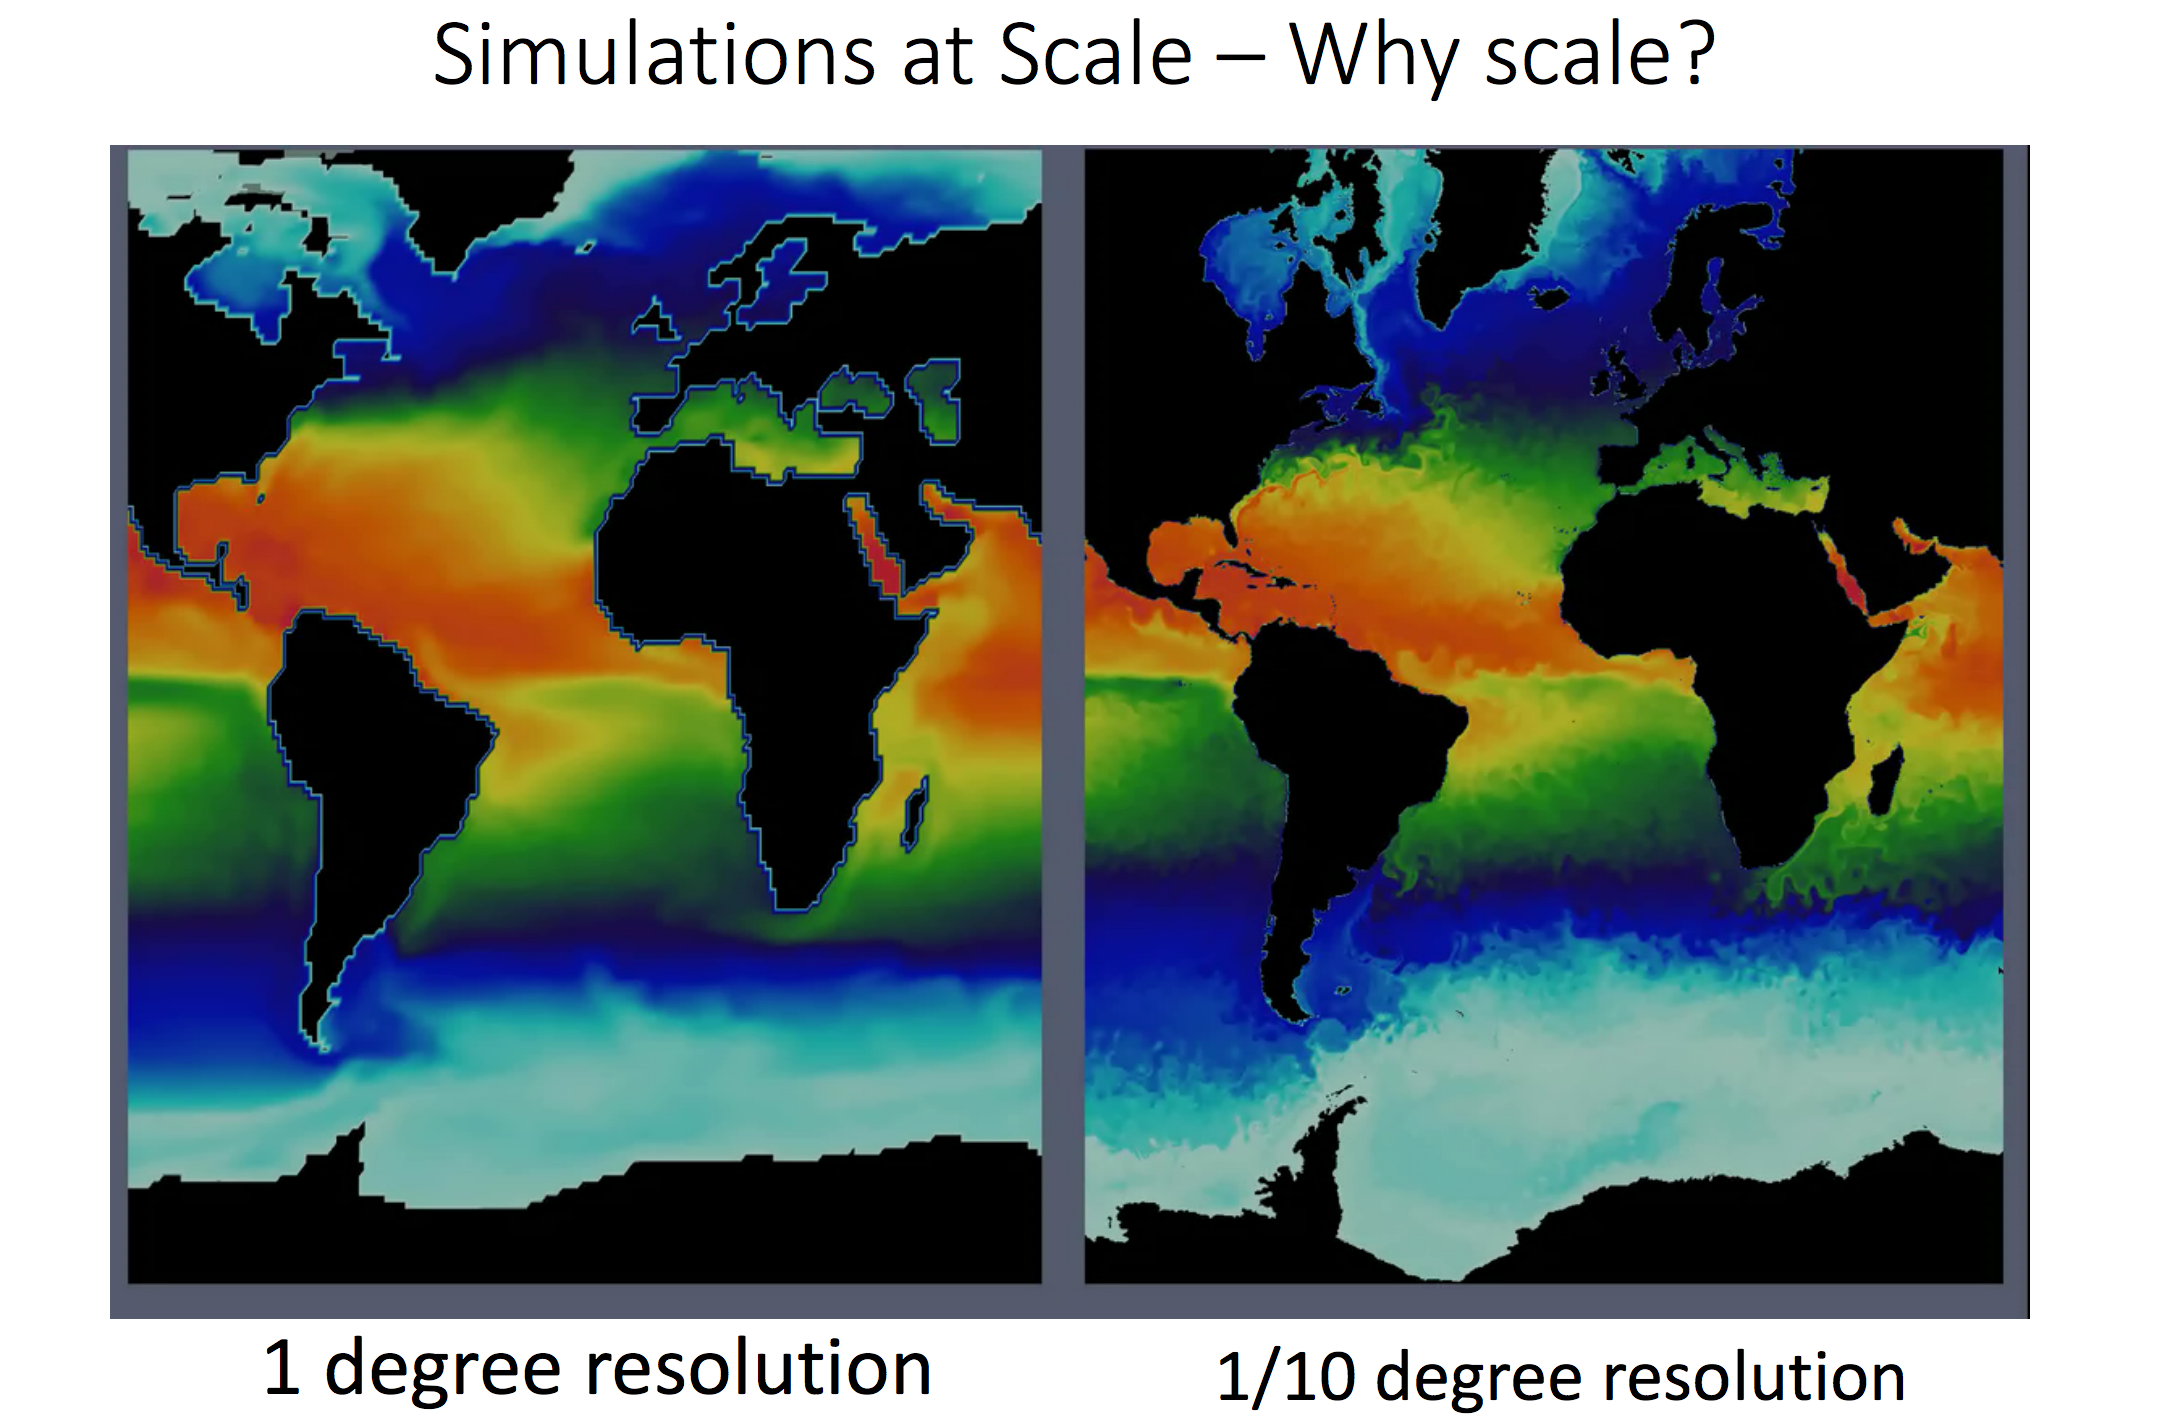
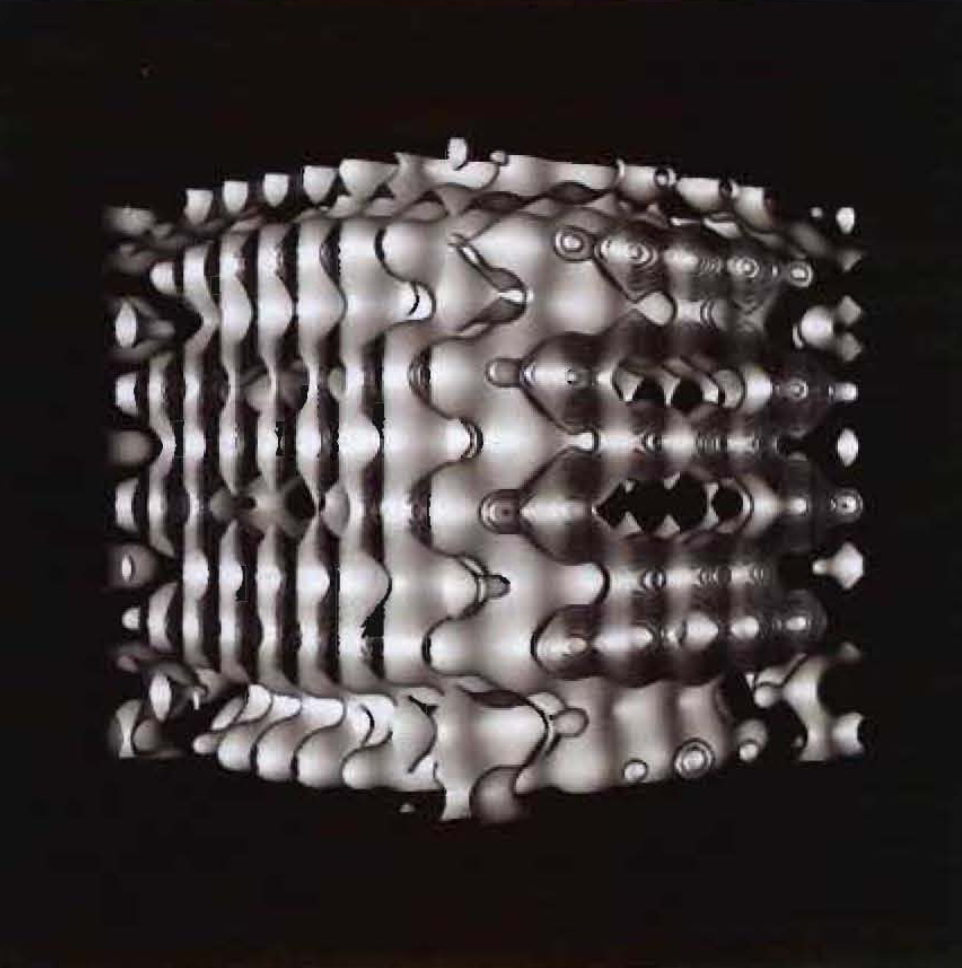
abstract = {Extremely large scale analysis is becoming increasingly important as supercomputers and their simulations move from petascale to exascale. The lack of dedicated hardware acceleration for rendering on today’s supercomputing platforms motivates our detailed evaluation of the possibility of interactive rendering on the supercomputer. In order to facilitate our understanding of rendering on the supercomputing platform, we focus on scalability of rendering algorithms and architecture envisioned for exascale datasets. To understand tradeoffs for dealing with extremely large datasets, we compare three different rendering algorithms for large polygonal data: software based ray tracing, software based rasterization and hardware accelerated rasterization. We present a case study of strong and weak scaling of rendering extremely large data on both GPU and CPU based parallel supercomputers using Para View, a parallel visualization tool. We use three different data sets: two synthetic and one from a scientific application. At an extreme scale, algorithmic rendering choices make a difference and should be considered while approaching exascale computing, visualization, and analysis. We find software based ray-tracing offers a viable approach for scalable rendering of the projected future massive data sizes.},
keywords = {exascale, large-scale data},
pubstate = {published},
tppubtype = {article}
}
Berres, Anne; Adhinarayanan, Vignesh; Turton, Terece; Feng, Wu; Rogers, David
A Pipeline for Large Data Processing Using Regular Sampling for Unstructured Grids Proceedings Article
In: 2017, (LA-UR-17-23903).
@inproceedings{info:lanl-repo/lareport/LA-UR-17-23903,

title = {A Pipeline for Large Data Processing Using Regular Sampling for Unstructured Grids},

author = {Anne Berres and Vignesh Adhinarayanan and Terece Turton and Wu Feng and David Rogers},

url = {http://datascience.dsscale.org/wp-content/uploads/2017/08/LA-UR-17-23903.pdf},

year  = {2017},

date = {2017-05-12},

abstract = {Large simulation data requires a lot of time and computational resources to compute, store, analyze, visualize, and run user studies. Today, the largest cost of a supercomputer is not hardware but maintenance, in particular energy consumption. Our goal is to balance energy consumption and cognitive value of visualizations of resulting data. This requires us to go through the entire processing pipeline, from simulation to user studies. To reduce the amount of resources, data can be sampled or compressed. While this adds more computation time, the computational overhead is negligible compared to the simulation time. We built a processing pipeline at the example of regular sampling. The reasons for this choice are two-fold: using a simple example reduces unnecessary complexity as we know what to expect from the results. Furthermore, it provides a good baseline for future, more elaborate sampling methods. We measured time and energy for each test we did, and we conducted user studies in Amazon Mechanical Turk (AMT) for a range of different results we produced through sampling.

},

note = {LA-UR-17-23903},

keywords = {},

pubstate = {published},

tppubtype = {inproceedings}

}
Ahrens, James Paul
01.11.2016, (Chesapeake Large-Scale Analytics Conference - CLSAC 2016, LA-UR-16-28491).
@misc{Ahrens_2016,

title = {Towards a Scalable, Platform Independent, User-Friendly Analysis Framework for Scientific and Information Oriented Applications},

author = {James Paul Ahrens},

url = {http://datascience.dsscale.org/wp-content/uploads/2017/08/LA-UR-16-28491.pdf},

year  = {2016},

date = {2016-11-01},

abstract = {Options for extreme scale data analysis are often presented as a stark contrast: write large files to disk for interactive exploratory analysis, or perform in situ analysis to save detailed data about phenomena that a user knows about in advance. We describe a novel framework that offers a middle ground - a highly interactive approach that promotes exploration of extracts from source data streams that significantly reduces data movement and storage. This framework is built upon a collection of scalable, platform independent, open-source packages (vtk and ParaView) that have been developed of the past two decades. In this talk, I will describe these frameworks, connections to information oriented streaming approaches, and highlight applications to real-world analysis challenges.},

note = {Chesapeake Large-Scale Analytics Conference - CLSAC 2016, LA-UR-16-28491},

keywords = {},

pubstate = {published},

tppubtype = {presentation}

}
Nouanesengsy, Boonthanome; Woodring, Jonathan; Patchett, John; Myers, Kary; Ahrens, James
ADR visualization: A generalized framework for ranking large-scale scientific data using Analysis-Driven Refinement Proceedings Article
In: Large Data Analysis and Visualization (LDAV), 2014 IEEE 4th Symposium on, pp. 43–50, IEEE 2014, (LA-UR-pending).
@inproceedings{nouanesengsy2014adr,

title = {ADR visualization: A generalized framework for ranking large-scale scientific data using Analysis-Driven Refinement},

author = {Boonthanome Nouanesengsy and Jonathan Woodring and John Patchett and Kary Myers and James Ahrens},

url = {http://datascience.dsscale.org/wp-content/uploads/2016/06/ADRVisualization.pdf},

year  = {2014},

date = {2014-01-01},

booktitle = {Large Data Analysis and Visualization (LDAV), 2014 IEEE 4th Symposium on},

pages = {43--50},

organization = {IEEE},

abstract = {Prioritization of data is necessary for managing large-scale scien- tific data, as the scale of the data implies that there are only enough resources available to process a limited subset of the data. For ex- ample, data prioritization is used during in situ triage to scale with bandwidth bottlenecks, and used during focus+context visualiza- tion to save time during analysis by guiding the user to impor- tant information. In this paper, we present ADR visualization, a generalized analysis framework for ranking large-scale data using Analysis-Driven Refinement (ADR), which is inspired by Adaptive Mesh Refinement (AMR). A large-scale data set is partitioned in space, time, and variable, using user-defined importance measure- ments for prioritization. This process creates a prioritization tree over the data set. Using this tree, selection methods can generate sparse data products for analysis, such as focus+context visualiza- tions or sparse data sets.},

note = {LA-UR-pending},

keywords = {},

pubstate = {published},

tppubtype = {inproceedings}

}
Patchett, John; Ahrens, James; Lo, Li-Ta; Browniee, Carson; Mitchell, Christopher; Hansen, Chuck
Approaching the Exa-Scale: a Real-World Evaluation of Rendering Extremely Large Data Sets Journal Article
In: 2010.
@article{Patchett_Ahrens_Lo_Browniee_Mitchell_Hansen_2010,

title = {Approaching the Exa-Scale: a Real-World Evaluation of Rendering Extremely Large Data Sets},

author = {John Patchett and James Ahrens and Li-Ta Lo and Carson Browniee and Christopher Mitchell and Chuck Hansen},

url = {http://datascience.dsscale.org/wp-content/uploads/2017/09/LA-UR-10-07016.pdf},

year  = {2010},

date = {2010-10-01},

abstract = {Extremely large scale analysis is becoming increasingly important as supercomputers and their simulations move from petascale to exascale. The lack of dedicated hardware acceleration for rendering on today’s supercomputing platforms motivates our detailed evaluation of the possibility of interactive rendering on the supercomputer. In order to facilitate our understanding of rendering on the supercomputing platform, we focus on scalability of rendering algorithms and architecture envisioned for exascale datasets. To understand tradeoffs for dealing with extremely large datasets, we compare three different rendering algorithms for large polygonal data: software based ray tracing, software based rasterization and hardware accelerated rasterization. We present a case study of strong and weak scaling of rendering extremely large data on both GPU and CPU based parallel supercomputers using Para View, a parallel visualization tool. We use three different data sets: two synthetic and one from a scientific application. At an extreme scale, algorithmic rendering choices make a difference and should be considered while approaching exascale computing, visualization, and analysis. We find software based ray-tracing offers a viable approach for scalable rendering of the projected future massive data sizes.},

keywords = {},

pubstate = {published},

tppubtype = {article}

}